Balloon Rockets
Having Fun with Newton’s
Laws of Motion
Newton’s Third Law (for every action there is a reaction) provides a basic explanation for how a
rocket engine works. The air trapped inside the balloon pushes out the open end, providing an
“action”. The balloon’s resulting motion is the “reaction”.
In this experiment you will measure and analyze the relationships between the volume of air in a
balloon and the distance, speed and average acceleration of its travels.
Objectives:
• Describe and explain the nature of the forces acting on and within an inflated balloon
held closed.
• Describe and explain the nature of the forces acting on and within an inflated balloon
when it released and free to move.
• Distinguish between independent and dependent variables in an experiment.
• Graphically represent relationships between the volume of air in a balloon and its
displacement when it is released.
Materials needed:
Balloons; smaller (7”-9”); larger (12”)
Balloon pump
String (fishing line) about 15 m long (35-40 feet)
Small S hook
Bag clip
Drinking straw
Cloth measuring tape
4 small washers (e.g., 1/8 x 3/4)
Scissors
Masking (painter’s) tape
Sharpie marker
Meter stick (or long measuring tape)
Stopwatch
Graph paper (or electronic spreadsheet)
Electronic balance (optional)
Watch the Balloon Rockets video on YouTube to get started: https://bit.ly/2PbQSeS
Experiment 1 – Distance of Motion
In the first experiment, you will blow up the balloon to different volumes and release it on a
string. In each trial, you will measure the distance the balloon travels, and make a graph of the
amount of air in the balloon versus distance traveled.
Work in groups of 3 or 4 for best results.
1. Find an area where you can stretch out a string to a length of 10-15 meters. Hook one end of
the string around a solid support. A member of your team will hold the other end tight when
you are ready to launch your balloon.
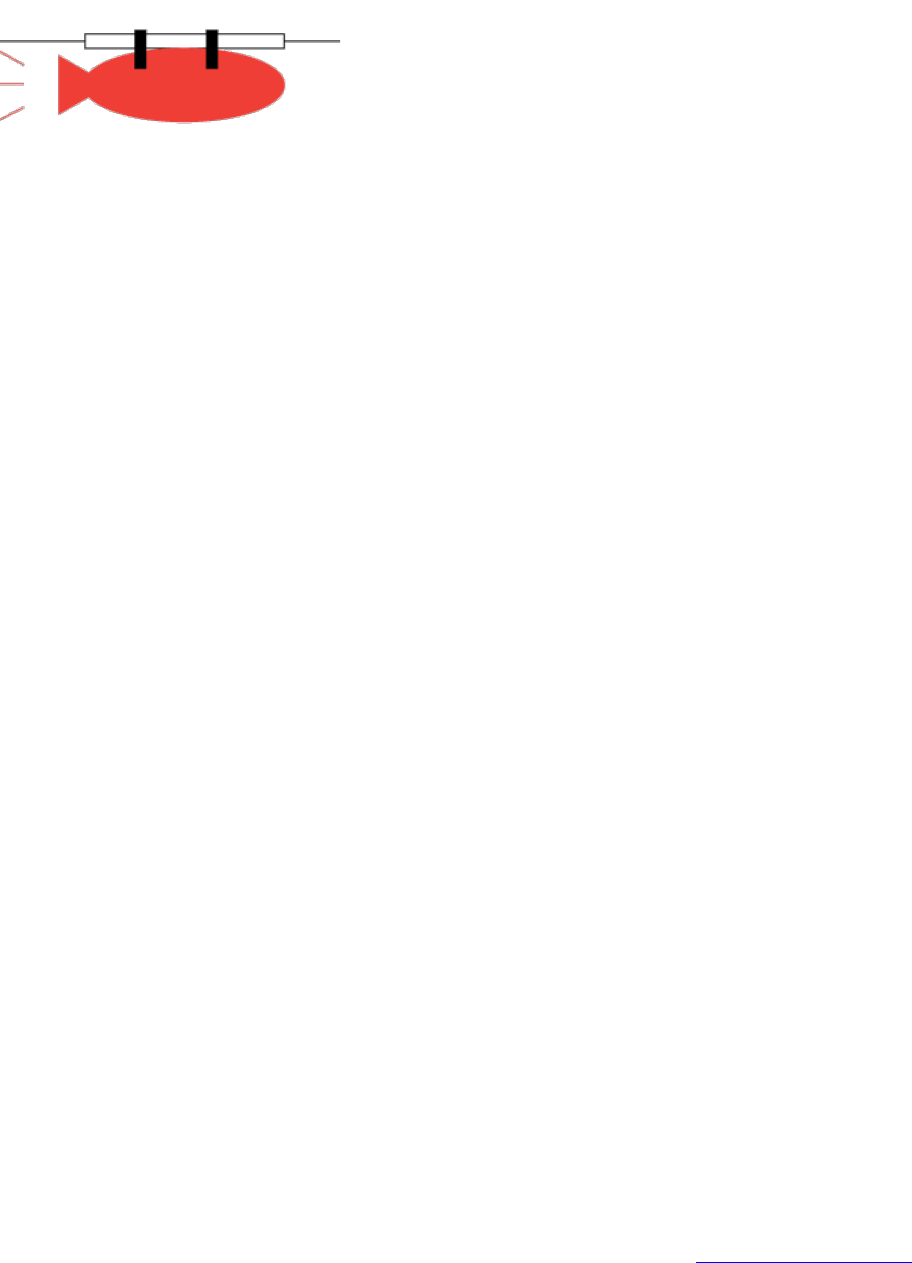
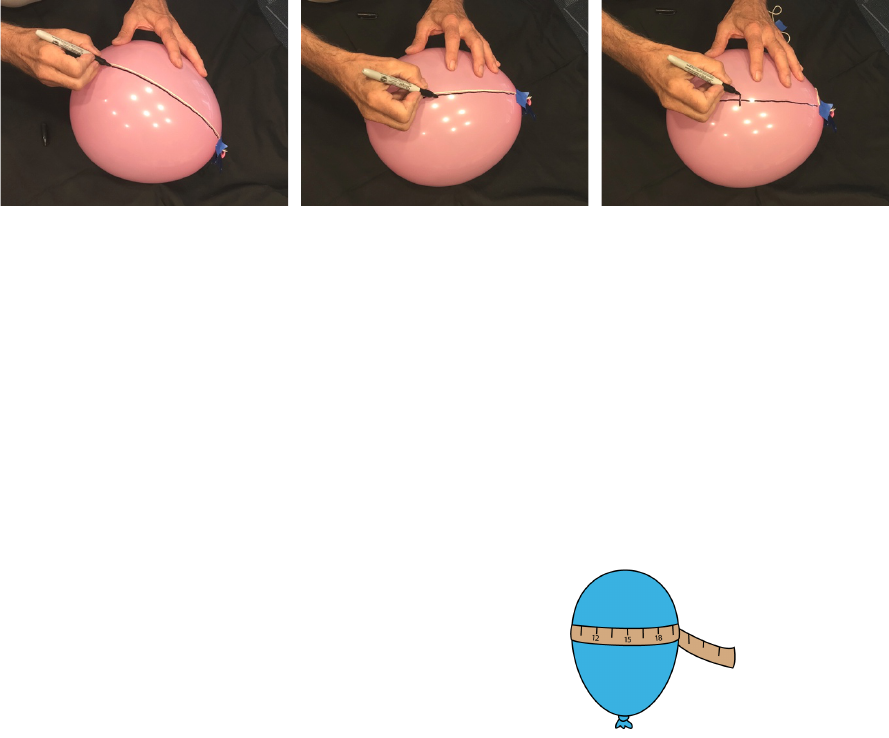
2. Partially inflate the balloon and tape a short piece of string from the nozzle to the center spot
on the bottom side (figure 1). Draw a straight line following the string.
3. Find the largest circumference and mark a line perpendicular to the central axis line. This will
be the center point of the surface of the balloon.
Figure 1. Finding the center point of the surface of the balloon
4. Cut the straw in half and pull the loose end of the string through it.
5. Mark a starting point with a piece of tape, close to the end of the string from which you will
launch your balloon rocket.
6. Decide which lab partner(s) who will
a. Pump and count the number of strokes to inflate the balloon.
b. Hold the lose end of the string tight and level
c. Locate and measure the distance traveled by the balloon when it stops
d. Tape the balloon to the straw and then release it.
7. When you are ready to conduct your flight, pump
up the balloon to the desired volume (or number
of pump strokes) and clamp the nozzle with a bag
clip.
8. Measure the circumference at the widest part of
the balloon with a measuring tape and record in
Image: https://www.education.com
Table 1.
9. Attach the balloon to the drinking straw with tape, following the guide marks you drew
before. The balloon should hang below the string.
10. When you are ready, count down and launch your balloon.
Balloon Rockets; David Sederberg Ph.D., dsederbe@purdue.edu
2

#
# # #
11. Locate the stopping point; measure and record the total distance traveled in Table 1.
12. Repeat steps 5 through 12 with different amounts of air in the balloon (i.e., different
circumferences) and record each trial in the first three columns of Table 1.
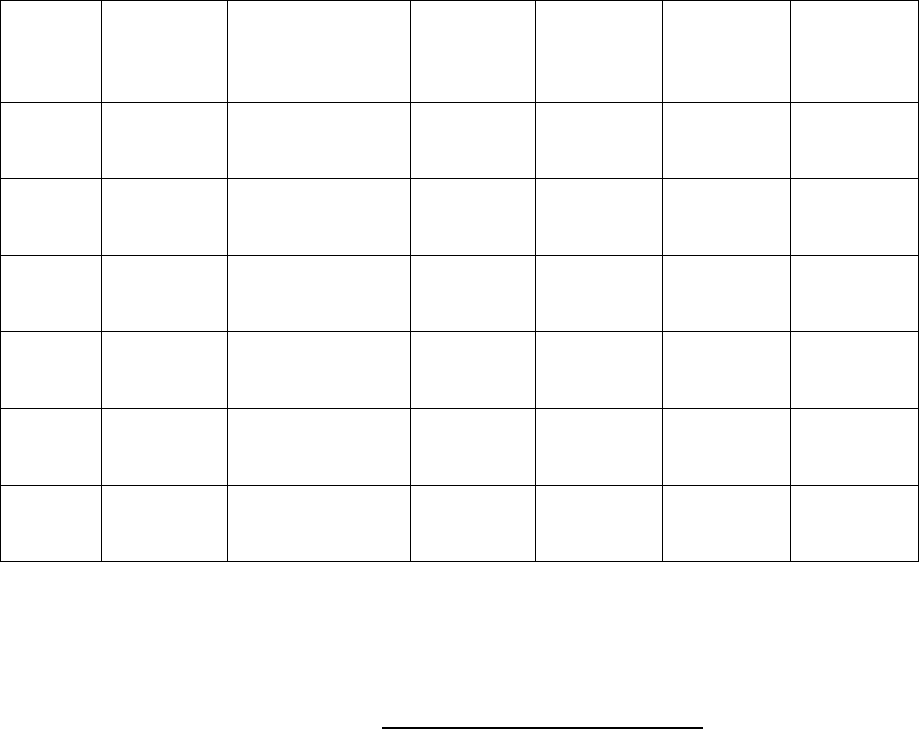
Table 1. Balloon flight data for different volumes.
Trial
number
Number of pump
strokes
Circumference (cm)
(amount of air)
Distance
traveled (m)
Diameter
(cm)
Volume of
balloon (cm
3
)
1
2
3
4
5
Calculations
1. Complete Table 1 by calculating the diameter of the balloon for each of your trial, and then
the volume, using the equations below.
2. Calculate the diameter from the measured circumference,
! "
$%&$'()*&*+$*
,
3. Once you have the diameter, you can calculate the volume of the balloon for each of your
trials; enter your results to complete Table 1.
- "
/
.
, !
!
Summary
Rockets work by very rapidly pushing gases out of their nozzles or engines in one direction. This
violent explosion of gasses pushes the rest of the rocket toward the opposite direction. This is an
example of Newton’s Third Law, “For every action there is an equal and opposite reaction.” The
word “equal” means that both the acting force and the resulting force are equal in magnitude or
amount. In other words, when you push on something, it pushes back on you just as hard.
Balloon Rockets; David Sederberg Ph.D., dsederbe@purdue.edu
3
1. Describe the forces and actions when you throw a tennis ball as hard as you can, using
the principles of Newton’s Third Law.
2. Apply the same principles to describe what happens when you rapidly push against a wall
as hard as you can.
3. Graph your results with amount of air (circumference, volume or number of pump
strokes) as the independent variable and distance traveled as the dependent variable.
Experiment 2 – Speed of Motion
The first rockets were invented by the Chinese, thousands of years ago, in the form of fireworks.
The same laws of physics put rockets to work carrying cargo.
In this experiment you will use a stopwatch to measure the time it takes for a balloon to travel
a fixed distance, based on its cargo (steel washers), and then calculate the balloon’s average
velocity. In each trial will use the same distance and the same amount of air in the balloon.
Your teacher will tell you what distance at which you will make your time measurements.
Your goal will be to graph your results comparing the mass of the cargo carried by the balloon
(independent variable) versus average velocity how fast it travels).
1. Set up and repeat the procedure you used previously, but use a new balloon. Use the same
string.
2. Place a piece of tape on the string to mark the starting and stopping points for each trial.
3. Decide which lab partners who will
a. Hold the lose end of the string tight and level
b. Use the stopwatch to time the time of flight.
c. Pump up the balloon.
d. Tape the balloon and extra mass (cargo) to the straw and release it.
4. Counting the number of pump strokes, inflate your balloon to about 1/2 of its total volume
and enter the pump strokes in Table 2. If required, measure the circumference.
5. Tape the balloon to the straw and prepare to launch.
6. Set the stopwatch to zero, place the balloon at the starting point on the string.
7. Count down and release your first balloon.
Balloon Rockets; David Sederberg Ph.D., dsederbe@purdue.edu
4
#
# # # #
# #
_______________
_______________
8. Record the time, the balloon hits the stopping point. Remember, you will use the same distance for
the remainder of your trials.
9. Repeat steps 3 through 8, taping one additional metal washer for each trial under the straw
before you attach the balloon. Record each trial in Table 2.
10. Under Calculations, calculate the average velocity for each of the trials and enter these
values in Table 2.
Table 2. Balloon flight data for different masses.
Trial
number
Number of
pump
strokes
Number of
washers)
Mass of
the cargo
(washers)
Distance
(same for
all trials)
Time
(seconds)
Average
velocity
1
0
2
1
3
2
4
3
5
4
6
5
Calculations
1. Complete Table 2 by calculating the average velocity for each of your trials,
!%536+$* 3&60*1*! 74 38* 761122+
0*12$%34 "
3%(* 2) )1%98 3
Trial number
Average velocity (cm/s)
Show your calculations
1
2
Balloon Rockets; David Sederberg Ph.D., dsederbe@purdue.edu
5
_______________
_______________
_______________
3
4
5
6
_______________
2. Enter your answers in Table 2.
3. Construct a graph, on either graph paper or the computer, to compare the mass of the cargo
(the washers) of the balloon rocket (x axis) and the average velocity of the balloon (y-axis).
Analysis
1. What conclusions could you make from your graph?
2. Write a sentence or two to summarize your findings of your experiment in terms of
Newton’s Third Law, in your own words.
Balloon Rockets; David Sederberg Ph.D., dsederbe@purdue.edu
6

Teacher Page
Balloon Rockets
Having Fun with Newton’s
Third Law of Motion
The purpose of this investigation is to allow students to design an experiment, selecting their
own independent variables (amounts of air in the balloon) to determine the relationship between
fuel (air) and distance traveled. From these data, student will be able to calculate average
velocity (speed), final velocity, and (if desired) average acceleration.
Depending on the algebraic skills of your students, they could calculate the volume of the
balloon and then different percentages of the volume (e.g., 85%, 70%, 65%, 50%, etc.) from
which they could calculate proportional circumferences (yes, it’s a little tedious). You could do
this beforehand and provide your own suggestions. Alternatively, students could choose their
own circumferences, starting with 95 cm for a 30 cm balloon fully inflated (e.g., 95 cm, 85 cm,
75, cm, 60 cm, etc.), for as many trials as you would like to have them make.
The most practical and efficient way to quantify the amount of air in the balloon is to count the
number of pump strokes. The graphs will look identical, whether students use pump stroked,
circumference, or volume. It comes down to how much math you want them to do.
Experiment 1
We prefer using a smaller (7-9 inch diameter) balloon for Experiment 1. Twelve inch balloons
have more air resistance at larger volumes, but feel free to experiment.
The following table provides examples of starting points, whether you choose to suggest
volumes, circumferences or diameters. Percent of initial volumes are merely provided as a
practical teacher reference. A quick and practical way to quantify the amount of air in the
balloon is to use the number of strokes of a balloon pump.
Table 1. Suggested amounts of air for a 7 inch balloon (values rounded)
Pump
strokes
Circumference
(cm)
Diameter
(cm)
Volume
3
cm
Distance (feet)
% of full
volume
11
58
30
3298
18.5
100
9
54
28
2662
15.5
80
7
50
27
2113
14
65
6
49
26
1989
12
65
4
42
24
1252
10.5
55
3
37
21
856
8
25
Balloon Rockets; David Sederberg Ph.D., dsederbe@purdue.edu
7

$
$ $ $
•
•
•
The diameter of the balloon can be approximated from the measured circumference,
%&'%()*+'+,%+
" #
-
The volume of the balloon can be approximated from diameter,
. #
0
/
- "
!
Experiment 2
We conducted Experiment with a 12” balloon inflated to 20 pump strokes (about 50% capacity).
A convenient mass increment is about 3 g. We have used small fender washers (a thin wide flat
washer) with an average mass of 2.9 g, although a common penny works well too.
Table 2. Balloon flight data for different masses.
Trial
number
Number
of pump
strokes
Number of
washers)
Total
mass
(balloon +
masses)
Distance
(feet)
Time
(seconds)
Average
velocity
(feet/s)
1
20
0
6.10
16
2.1
2.32
2
20
1
9.00
16
2.53
1.93
3
20
2
11.90
16
2.89
1.69
4
20
3
14.80
16
3.08
1.58
Average velocity
Mass versus average velocity
2.40
2.20
2.00
1.80
1.60
1.40
1.20
1.00
0.00 2.00 4.00 6.00 8.00 10.00 12.00 14.00 16.00
Combined mass of balloon and washers
Balloon Rockets; David Sederberg Ph.D., dsederbe@purdue.edu
8

•
•
• •
A Word about Acceleration
If you choose, you can have students try to calculate the average acceleration for each trial.
Interestingly, you might expect that the more a balloon is inflated, the greater the acceleration.
Actually this is not the case. The more air, the further it will go, but the thrust of the air leaving
the nozzle is the same. In fact the acceleration will appear to decrease with more air, one reason
due to air resistance.
In Experiment 2, however, acceleration can be calculated, since the only variable changing is
the mass of the cargo. Although the acceleration throughout the flight is not constant, we can
still measure the average acceleration, using the distance (s) and time, s = ½ a t
2
. Rearranging,
the average acceleration will be 2s/t
2
.
The average acceleration for the these four trials is shown in Table 3.
Table 3. Average acceleration versus mass of balloon and cargo
Average velocity (feet/s)
Average acceleration (feet/s/s)
2.32
7.26
1.93
5.00
1.69
3.83
1.58
3.37
Mass versus average acceleration
8.00
7.00
6.00
5.00
4.00
3.00
2.00
1.00
0.00
0.00 2.00 4.00 6.00 8.00 10.00 12.00 14.00 16.00
Combined mass of balloon and washers
Pedagogical suggestions:
• If time is an issue, student groups could be assigned different circumferences or volumes
of air (pump strokes), rather than each group doing all five trials, and then class data
combined and graphed collectively.
• Have students practice each experiment with 1 or 2 runs before they begin to collect data,
to get the feel for what they will do and what to expect.
Average acceleration
Balloon Rockets; David Sederberg Ph.D., dsederbe@purdue.edu
9
• Students should work in groups of at least three, two pairs of hands just are not enough.
Eight hands is best; six can make do.
• Balloon pumps are required, not only for hygiene, but also for convenience. In fact the
amount of air in the balloon can be based on the number of full strokes on the pump,
rather than having to measure circumference and calculating volume, if algebra is a
problem.
• Have students remove the balloon from the pump as soon as possible once it is inflated to
the desired volume to avoid losing any air. A bag clip will serve to seal the end until
launch.
• When ready to launch, have students hold the nozzle of the balloon, remove the bag clip,
and the release the balloon from their fingers. Just pulling off the bag clip will not
provide reliable or consistent results.
• If you chose, students can measure the circumference with a tape, to a certain volume,
one student pumps, another measures. This may be cumbersome, so another idea would
be for the teacher to figure out in advance the number of pump strokes as a guide and
then have students measure the circumference once the balloon are pumped up.
• In Experiment 1, students will be measuring the distance traveled in each of the trials. It
may be useful to have them mark off 1 m (or, for example 5 foot) increments on the floor
with tape to not have to measure from zero distance every time. The tape markers could
also be used for successive classes.
• Have students mark starting point on the string with a piece of tape. In Experiment 2,
they will require instruction where to mark the (same) stopping point for each trial. A
piece of painter’s tape is sufficient.
• Experiment 2 requires a pre-determined stopping point. You can experiment to find what
works best for your situation. We used 12” balloons with 20 pump strokes (about 50%
capacity), with a stopping distance of 16 feet. This should be determined by the distance
the balloon with 5 masses (washers) attached. Longer distances will provide longer
times, which are easier for students to measure, but the larger volumes may introduce a
little more air resistance, although it will not be a problem for the main point of the
experiment.
• The washer masses we use for Experiment 2 are 1/8” x ¾ inch fender washer with a mass
of about 2.9 g on average. Have student tape one additional washer for each successive
trial on the underside of the straw, before taping the straw to the balloon. That will keep
the balloon from flipping over in flight.
• In Experiment 2, students can use a phone stopwatch, although they can be a little tricky
to make sure the start and stop are pressed at the right instant. A mechanical stopwatch
has a button that is easier to feel in the hand without having to look.
• We recommend using new balloons for each class, and even between Experiments 1 and
2. They tend to lose their stretch after being repeatedly inflated.
Balloon Rockets; David Sederberg Ph.D., dsederbe@purdue.edu
10
