
ANNUAL
REPORT
2021-2022
_____________________________________________________
Springfield Public Schools
Kraft Administrative Center
1359 E. St. Louis St.
Springfield, MO 65802
Phone: 417-523-0000
http://www.sps.org
The following information is compiled as a report to the community on the
status and performance of Springfield Public Schools and its students.
_____________________________________________________
Springfield Public Schools
Annual Report
2021-2022
About the Report
The Springfield Public School District is fully committed to open, two-way communication
with staff, parents of our students, and all citizens who are concerned about education.
Our continued commitment to meeting this goal is the reason for the annual report.
The district annual report has been produced every year since 1986. It was expanded
in 1996 to meet state public reporting requirements for all school districts in Missouri at
that time. The report includes student enrollment numbers, attendance figures, and
high school dropout rates. Also included is data about the amount of state and federal
aid received by our district and the number of students who qualified for free and
reduced lunch. In addition, tax information and statistics about teaching and
administrative staff, average salaries earned, and percentage of teachers with
advanced degrees are also provided for individual school buildings within the district.
Springfield Public Schools
Annual Report Index
2021-2022
STUDENT INFORMATION ....................................................................................................... 1
ENROLLMENT BY RACE AND ETHNICITY: ELEMENTARY ................................. 1
ENROLLMENT BY RACE AND ETHNICITY: SECONDARY ................................... 2
MOBILITY / STABILITY / ATTENDANCE REPORT: ELEMENTARY .................... 3
MOBILITY / STABILITY / ATTENDANCE REPORT: SECONDARY ...................... 4
STUDENT DROPOUTS ................................................................................................... 5
GRADUATION RATE ....................................................................................................... 6
STAFFING INFORMATION ...................................................................................................... 7
STAFF TO STUDENT RATIOS: ELEMENTARY ........................................................ 7
STAFF TO STUDENT RATIOS: SECONDARY .......................................................... 8
STAFF DEGREE & SALARY INFORMATION: ELEMENTARY .............................. 9
STAFF DEGREE & SALARY INFORMATION: SECONDARY .............................. 10
STAFF DEGREE & SALARY INFORMATION: DISTRICT VS STATE ................ 12
STUDENT ACHIEVEMENT .................................................................................................... 13
ACT SCORES: 10 YEAR HISTORY ............................................................................ 13
ACT SCORES: CHANGE HISTORY ........................................................................... 14
ACT SCORES: STATE REPORTED GRADUATES ................................................ 20
MISSOURI ASSESSMENT PROGRAM (MAP) ......................................................... 21
MAP: STATE TOTALS 2021-2022 .............................................................................. 22
MAP: DISTRICT TOTALS 2021-2022 ......................................................................... 23
MAP: END-OF-COURSE TOTALS 2021-2022 ......................................................... 24
MAP: MIDDLE SCHOOL TOTALS 2021-2022 .......................................................... 25
MAP: ELEMENTARY TOTALS 2021-2022 ................................................................ 27
FREE & REDUCED LUNCH INFORMATION ...................................................................... 34
FREE & REDUCED LUNCH: ELEMENTARY ........................................................... 34
FREE & REDUCED LUNCH: SECONDARY ............................................................. 35
SPECIAL PROGRAMS ............................................................................................................. 36
PARTICIPATION IN SPECIAL PROGRAMS............................................................. 36
GRADUATE FOLLOW-UP ...................................................................................................... 37
GRADUATE FOLLOW-UP HISTORY ......................................................................... 37
OTC GRADUATE FOLLOW-UP .................................................................................. 38
MISSOURI SCHOOL IMPROVEMENT PROGRAM (MSIP) 6 ............................................. 39
CONTINUOUS IMPROVEMENT PLAN ................................................................................ 40
FINANCIAL DATA .................................................................................................................. 41
FINANCIAL OVERVIEW & COMPARISON ............................................................... 41
ADDITIONAL INFORMATION .............................................................................................. 42
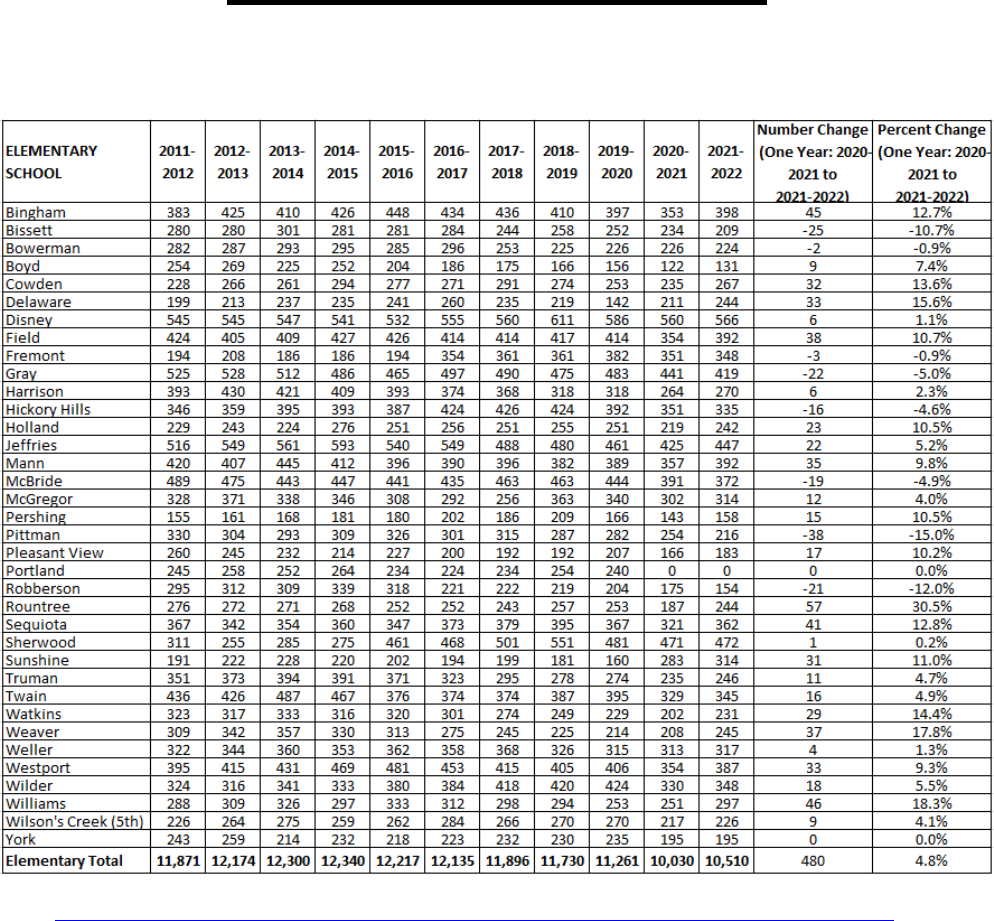
SEPTEMBER ENROLLMENT HISTORY: ELEMENTARY ..................................... 42
SEPTEMBER ENROLLMENT HISTORY: SECONDARY ....................................... 43
EARLY CHILDHOOD SPECIAL EDUCATION .......................................................... 44
GRADE DISTRIBUTION SUMMARY: HIGH SCHOOL ........................................... 45
DISCIPLINARY ACTIONS ............................................................................................ 46

1
STUDENT INFORMATION
ENROLLMENT BY RACE AND ETHNICITY: ELEMENTARY
SEPTEMBER 2021-2022
Source: 2022 October Student Core File (data as of 10/15/2021), Missouri Student Information System (MOSIS) data
collection/reporting

2
ENROLLMENT BY RACE AND ETHNICITY: SECONDARY
SEPTEMBER 2021-2022
Source: 2022 October Student Core File (data as of 10/15/2021), Missouri Student Information System (MOSIS) data
collection/reporting

3
MOBILITY / STABILITY / ATTENDANCE REPORT: ELEMENTARY
AUGUST 16, 2021 – MAY 25, 2022
Mobility = Sum of official June transfers in plus transfers out, divided by official September enrollment.
Stability = Official June count of students enrolled all year, divided by official September enrollment.
Note: Attendance is based on district attendance calculations.
Source: 2022 October Student Core File (data as of 10/15/2021) and 2022 June Enrollment File (data as of 11/13/2022), Missouri
Student Information System (MOSIS) data collection/reporting and SPS building reported attendance

4
MOBILITY / STABILITY / ATTENDANCE REPORT: SECONDARY
AUGUST 16, 2021 – MAY 25, 2022
Mobility = Sum of official June transfers in plus transfers out, divided by official September enrollment.
Stability = Official June count of students enrolled all year, divided by official September enrollment.
Note: Attendance is based on district attendance calculations.
Source: 2022 October Student Core File (data as of 10/15/2021) and 2022 June Enrollment File (data as of 11/13/2022), Missouri
Student Information System (MOSIS) data collection/reporting and SPS building reported attendance

5
STUDENT DROPOUTS
2021-2022
Dropout Rate = For grades 9-12, the number of dropouts divided by the total of September enrollment, plus transfers in, minus
transfers out, minus dropouts, added to September enrollment, then divided by two.
Source: Missouri Department of Elementary and Secondary Education MCDS Portal > Students > Graduation & Dropout Rates

6
GRADUATION RATE
GRADUATING CLASSES OF 2021 AND 2022
Four-Year Graduation Rate: Percentage of freshmen students who graduate in four years with a regular high school diploma. From
the beginning of ninth grade, students who are entering ninth grade for the first time form a cohort. The cohort is subsequently
"adjusted" by adding any students who transfer into the cohort at any point before graduation and subtracting any students who
transfer out.
Five-Year Graduation Rate: The five-year graduation rate is calculated the same as the four-year with the exception that it includes
both four and five-year graduates in the fifth-year cohort.
Source: Missouri Department of Elementary and Secondary Education MCDS Portal > Students > Graduation & Dropout Rates

7
STAFFING INFORMATION
STAFF-TO-STUDENT RATIOS: ELEMENTARY
2021-2022
Students to Classroom Teachers: Regular classroom teachers (Core Data position code 60), excluding special education, remedial
reading, Title I, and vocational teachers.
Source: 2022 October Educator File (data as of 11/16/2022), Missouri Student Information System (MOSIS) data
collection/reporting

8
STAFF-TO-STUDENT RATIOS: SECONDARY
2021-2022
Students to Classroom Teachers: Regular classroom teachers (Core Data position code 60), excluding special education, remedial
reading, Title I, and vocational teachers.
Launch teachers are reported to Bingham, Carver, and Central which accounts for the lower ratios at those buildings. Excluding
Launch teachers results in the following ratios:
Building
Official
Enrollment
Students to
Administrators
Students to All
Teachers
Students to
Classroom
Teachers
Bingham
400
398
14
19
Carver
735
366
16
19
Central
1688
375
19
23
Source: 2022 October Educator File (data as of 11/16/2022), Missouri Student Information System (MOSIS) data
collection/reporting

9
STAFF DEGREE & SALARY INFORMATION: ELEMENTARY
2021-2022

10
Average Teacher Salaries: The average regular term (base) salary of teachers (Core Data position code 60) and the average total
salary (includes extended-contract salary, Career Ladder supplement, and extra-duty pay) for teachers in the district. Fringe benefits
are not included. *Bingham Elementary absorbs part-time Launch virtual elementary teachers.
Source: 2022 October Educator and School Files (data as of 11/16/2022), Missouri Student Information System (MOSIS) data
collection/reporting
STAFF DEGREE & SALARY INFORMATION: SECONDARY
2021-2022
Average Teacher Salaries: The average regular term (base) salary of teachers (Core Data position code 60) and the average total
salary (includes extended-contract salary, Career Ladder supplement, and extra-duty pay) for teachers in the district. Fringe benefits
are not included. *Carver Middle School and Central High School absorb part-time Launch virtual teachers.
Launch teachers are reported to Bingham, Carver, and Central which accounts for the lower figures at those buildings. Excluding
Launch teachers results in the following ratios:
Building
% of Faculty
with Master’s
Degree or
Higher
Average Years
of Experience
Average
Teacher Salary
– Regular Term
Average
Teacher Salary
– Total
Bingham
37%
10.7
$49,817
$49,817
Carver
62.2%
12.2
$52,048
$52,048
Central
62.8%
11.8
$51,127
$51,127
Source: 2022 October Educator and School Files (data as of 11/16/2022), Missouri Student Information System (MOSIS) data
collection/reporting
11

12
STAFF DEGREE & SALARY INFORMATION: DISTRICT VS STATE
2021-2022
District
State
Average Teacher Salary –
Regular Term
$45,445 $52,334
Average Teacher Salary –
Total
$45,485 $53,512
Average Salary of all
Administrators
$99,865 $98,734
Average Years of Experience
of Professional Staff
10.7 13.1
Percent of Faculty with
Master’s Degree or Higher
56% 62%
Student/Staff Ratio -
Classroom Teachers
14 16
Student/Staff Ratio -
Administrators
262 167
Average Teacher Salaries: The average regular term (base) salary of teachers (Core Data position code 60) and the average total
salary (includes extended-contract salary, Career Ladder supplement, and extra-duty pay) for teachers in the district. Fringe benefits
are not included. *This includes part-time Launch virtual teachers.
Average Administrator Salaries: The average administrator salary (Core Data position codes 10 and 20). Fringe benefits are not
included
Average Years of Experience: The average years of public school experience for all members of the district’s professional staff
(Core Data position codes 10-60).
Students to Classroom Teachers: Regular classroom teachers (Core Data position code 60), excluding special education, remedial
reading, Title I, and vocational teachers.
Students to Administrators: Central office and building-level administrators (Core Data position codes 10 and 20).
Source: Missouri Department of Elementary and Secondary Education MCDS Portal > Report Card > Report Card

13
STUDENT ACHIEVEMENT
ACT SCORES: 10-YEAR HISTORY
GRADUATING CLASSES OF 2013 TO 2022
Source: The ACT Profile Report, ACT Inc.
Year
Local
Frequency
English
Math
Reading
Science
Composite
2012-2013
SPS District
1,078
22.2
21.4
22.7
22.0
22.2
2013-2014
SPS District
999
22.0
21.6
23.1
22.4
22.4
2014-2015
SPS District
1,067
22.4
21.7
23.0
22.4
22.5
2015-2016
SPS District
1,548
20.2
20.2
21.2
20.9
20.8
2016-2017
SPS District
1,605
19.9
19.8
20.9
20.5
20.4
2017-2018
SPS District
1,538
19.8
19.5
20.5
20.2
20.1
2018-2019
SPS District
1,559
19.5
19.4
20.5
20.1
20.0
2019-2020
SPS District
1,561
18.9
18.8
20.3
19.7
19.5
2020-2021
SPS District
1,335
19.6
19.3
21.1
20.3
20.0
2021-2022
SPS District
1,362
19.1
18.7
20.8
20.0
19.8
Year
State
Frequency
English
Math
Reading
Science
Composite
2012-2013
State
49,217
21.4
21.0
21.9
21.6
21.6
2013-2014
State
48,865
21.6
21.1
22.3
21.7
21.8
2014-2015
State
49,640
21.4
21.0
22.2
21.7
21.7
2015-2016
State
68,446
19.7
19.8
20.6
20.4
20.2
2016-2017
State
68,480
19.8
19.9
20.8
20.5
20.4
2017-2018
State
68,424
19.5
19.7
20.5
20.0
20.0
2018-2019
State
56,238
20.3
20.2
21.3
20.8
20.8
2019-2020
State
53,374
20.1
20.1
21.3
20.8
20.7
2020-2021
State
45,530
19.9
19.9
21.3
20.7
20.6
2021-2022
State
47,491
19.5
19.5
21.0
20.4
20.3
Year
National
Frequency
English
Math
Reading
Science
Composite
2012-2013
National
1,799,243
20.2
20.9
21.1
20.7
20.9
2013-2014
National
1,845,787
20.3
20.9
21.3
20.8
21.0
2014-2015
National
1,924,436
20.4
20.8
21.4
20.9
21.0
2015-2016
National
2,090,342
20.1
20.6
21.3
20.8
20.8
2016-2017
National
2,030,038
20.3
20.7
21.4
21.0
21.0
2017-2018
National
1,914,817
20.2
20.5
21.3
20.7
20.8
2018-2019
National
1,782,820
20.1
20.4
21.2
20.6
20.7
2019-2020
National
1,670,497
19.9
20.2
21.2
20.6
20.6
2020-2021
National
1,295,349
19.6
19.9
20.9
20.4
20.3
2021-2022
National
1,349,644
19.0
19.3
20.4
19.9
19.8

14
ACT SCORES: CHANGE HISTORY
2020-2021 TO 2021-2022
Source: The ACT Profile Report, ACT Inc.
Average Composite Score
Number of Students Tested
School
2020-2021
2021-2022
Change
2020-2021
2021-2022
Change
Central
21.1
21.5
0.4
230
257
27
Glendale
21.3
20.5
-0.8
250
278
28
Hillcrest
16.8
16.6
-0.2
168
170
2
Kickapoo
21.0
20.4
-0.6
419
431
12
Parkview
18.0
18.0
0
268
226
-42
District
20.0
19.8
-0.2
1,335
1,362
27
2022 SPS below the state average: -0.5
2022 SPS equals the national average: 0.0

20
ACT SCORES: STATE-REPORTED GRADUATES
2017-2018 TO 2021-2022
2017-2018
Central
Glendale
Hillcrest
Kickapoo
Parkview
District
State
National
% of Graduates
Taking ACT
82.5%
92.5%
85.7%
91.4%
82.5%
87.4%
91.8%
55.0%
ACT Composite
Score
22.6
20.3
18.0
21.3
18.9
20.4
19.9
20.8
2018-2019
Central
Glendale
Hillcrest
Kickapoo
Parkview
District
State
National
% of Graduates
Taking ACT
73.8%
93.3%
82.1%
95.1%
80.9%
85.7%
82.0%
52.0%
ACT Composite
Score
22.1
21.1
17.5
21.2
18.1
20.4
20.6
20.7
2019-2020
Central
Glendale
Hillcrest
Kickapoo
Parkview
District
State
National
% of Graduates
Taking ACT
80.3%
86.0%
75.9%
86.6%
78.3%
82.0%
75.1%
*
ACT Composite
Score
21.3
20
17.7
21.4
18.5
20.0
20.7
*
2020-2021
Central
Glendale
Hillcrest
Kickapoo
Parkview
District
State
National
% of Graduates
Taking ACT
66.1%
74.9%
64%
81.8%
78.8%
74.3%
59.4%
*
ACT Composite
Score
21.1
21.3
16.8
21.0
18.0
20.0
20.9
20.3
2021-2022
Central
Glendale
Hillcrest
Kickapoo
Parkview
District
State
National
% of Graduates
Taking ACT
68.2%
79.4%
69.4%
84.5%
71.7%
75.8%
63.9%
36%
ACT Composite
Score
21.5
20.5
16.6
20.
18.0
19.8
20.3
19.8
* National ACT data is not available.
Source: Missouri Department of Elementary and Secondary Education MCDS Portal > Report Card > Report Card
and The Condition of College & Career Readiness, ACT Inc.

21
MISSOURI ASSESSMENT PROGRAM (MAP)
The Missouri Department of Elementary and Secondary Education (DESE) requires all Missouri public
school districts to administer Missouri Assessment Program (MAP) assessments in the spring. Under
the Missouri Assessment Program, End-of-Course (EOC) assessments are also administered at the
end of appropriate secondary courses for accountability purposes. State assessments are
administered in the following grade levels and End-of-Course areas:
MISSOURI ASSESSMENT PROGRAM (MAP)
2022 TEST RESULTS
The following Missouri Assessment Program (MAP) Test results for Springfield Public School
District and buildings within the district.
STATE-REQUIRED MAP TESTING
COMMUNICATION ARTS MATHEMATICS SCIENCE SOCIAL STUDIES
Grade 3
Grade 3
Grade 5
American Gov. (GV)
Grade 4
Grade 4
Grade 8
Grade 5
Grade 5
Biology 1 (B1)
Grade 6
Grade 6
Grade 7
Grade 7
Grade 8
Grade 8
English 2 (E2)
Algebra 1 (A1)
Algebra 2 (A2)
Geometry (GE)
22
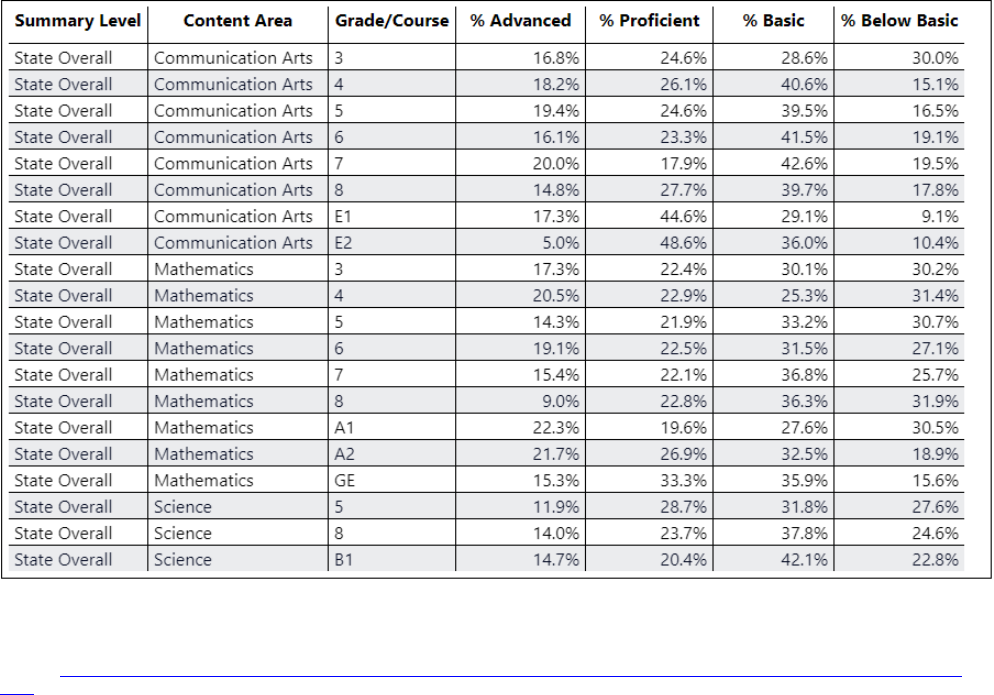
MISSOURI ASSESSMENT PROGRAM (MAP)
MAP: STATE TOTALS 2021-2022
E2, A1, A2, GE, B1, and GV indicate English 2, Algebra 1, Algebra 2, Geometry, and Biology 1 End-of-Course assessments, respectively.
Source:
Missouri Department of Elementary and Secondary Education MCDS Portal > Students > Missouri Assessment Program (MAP)
Data
23
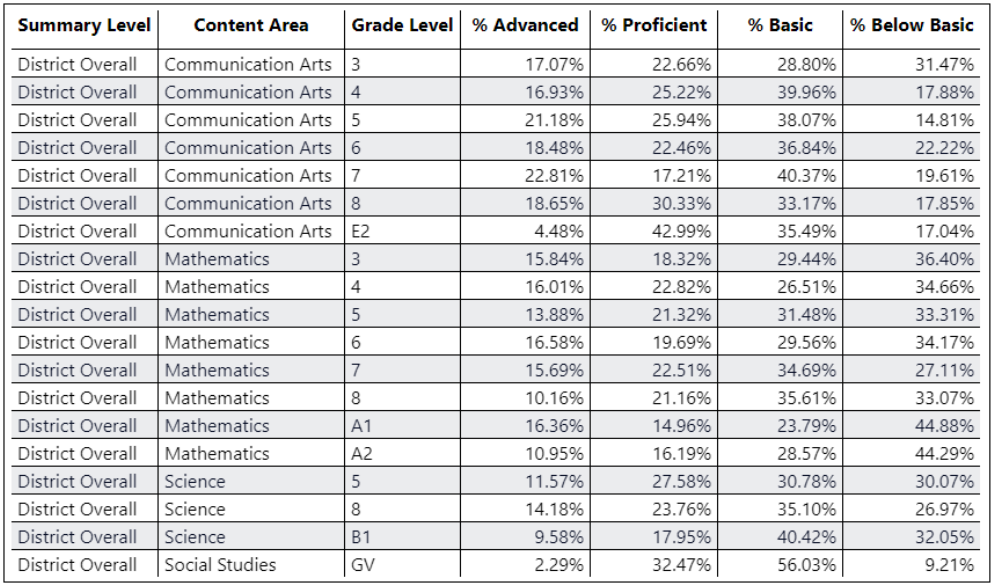
MISSOURI ASSESSMENT PROGRAM (MAP)
MAP: DISTRICT TOTALS 2021-2022
E2, A1, A2, GE, B1, and GV indicate English 2, Algebra 1, Algebra 2, Geometry, and Biology 1 End-of-Course assessments, respectively.
Source: 2022 MAP Score File, Missouri Department of Elementary and Secondary Education
24
MISSOURI ASSESSMENT PROGRAM (MAP)
MAP: END-OF-COURSE TOTALS 2021-2022
E2, A1, A2, GE, B1, and GV indicate English 2, Algebra 1, Algebra 2, Geometry, and Biology 1 End-of-Course assessments, respectively.
Source: 2022 MAP Score File, Missouri Department of Elementary and Secondary Education

25
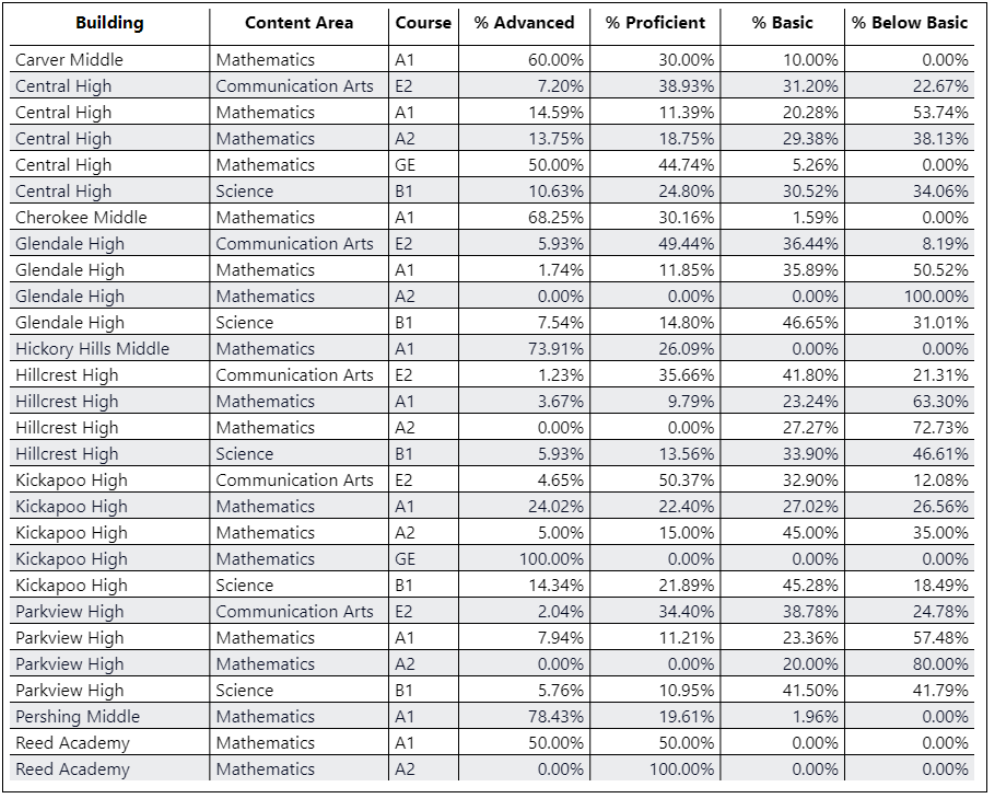
MISSOURI ASSESSMENT PROGRAM (MAP)
MAP: MIDDLE SCHOOL TOTALS 2021-2022
Source: 2022 MAP Score File, Missouri Department of Elementary and Secondary Education

26
MISSOURI ASSESSMENT PROGRAM (MAP)
MAP: MIDDLE SCHOOL TOTALS 2021-2022
(CONTINUED)
Source: 2022 MAP Score File, Missouri Department of Elementary and Secondary Education

27
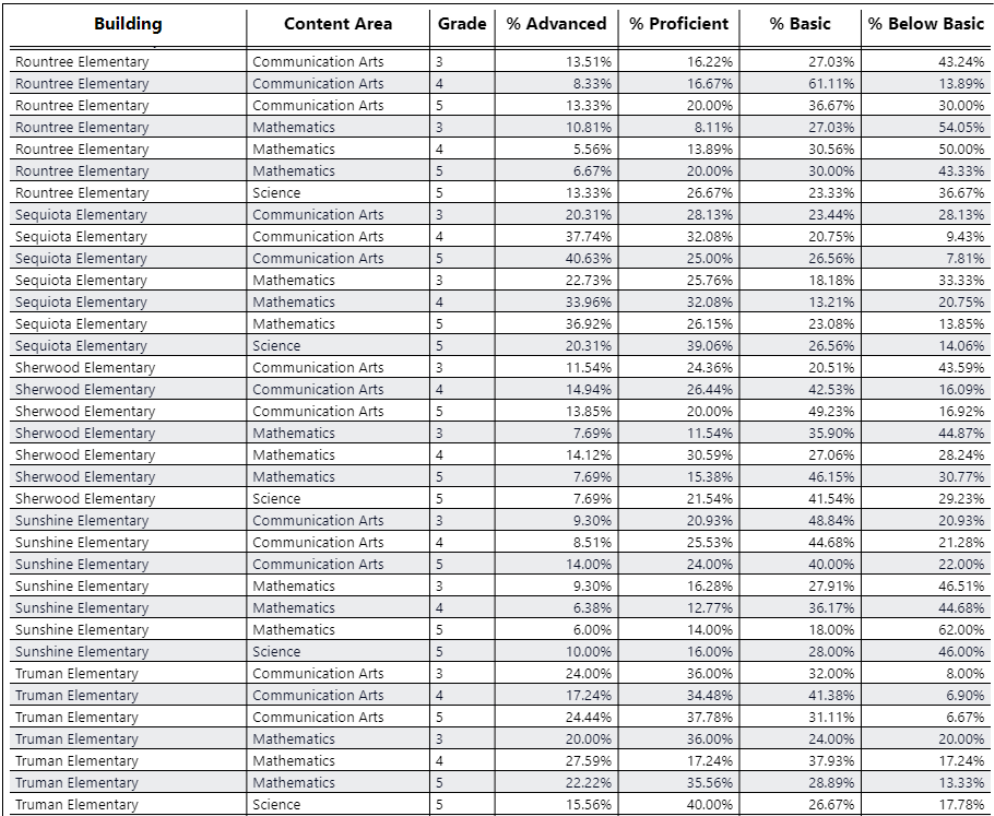
MISSOURI ASSESSMENT PROGRAM (MAP)
MAP: ELEMENTARY TOTALS 2021-2022
Source: 2022 MAP Score File, Missouri Department of Elementary and Secondary Education

28
MISSOURI ASSESSMENT PROGRAM (MAP)
MAP: ELEMENTARY TOTALS 2021-2022
(CONTINUED)
Source: 2022 MAP Score File, Missouri Department of Elementary and Secondary Education

29
MISSOURI ASSESSMENT PROGRAM (MAP)
MAP: ELEMENTARY TOTALS 2021-2022
(CONTINUED)
Source: 2022 MAP Score File, Missouri Department of Elementary and Secondary Education

30
MISSOURI ASSESSMENT PROGRAM (MAP)
MAP: ELEMENTARY TOTALS 2021-2022
(CONTINUED)
Source: 2022 MAP Score File, Missouri Department of Elementary and Secondary Education
31
MISSOURI ASSESSMENT PROGRAM (MAP)
MAP: ELEMENTARY TOTALS 2021-2022
(CONTINUED)
Source: 2022 MAP Score File, Missouri Department of Elementary and Secondary Education

32
MISSOURI ASSESSMENT PROGRAM (MAP)
MAP: ELEMENTARY TOTALS 2021-2022
(CONTINUED)
Source: 2022 MAP Score File, Missouri Department of Elementary and Secondary Education

33
MISSOURI ASSESSMENT PROGRAM (MAP)
MAP: ELEMENTARY TOTALS 2021-2022
(CONTINUED)
Source: 2022 MAP Score File, Missouri Department of Elementary and Secondary Education
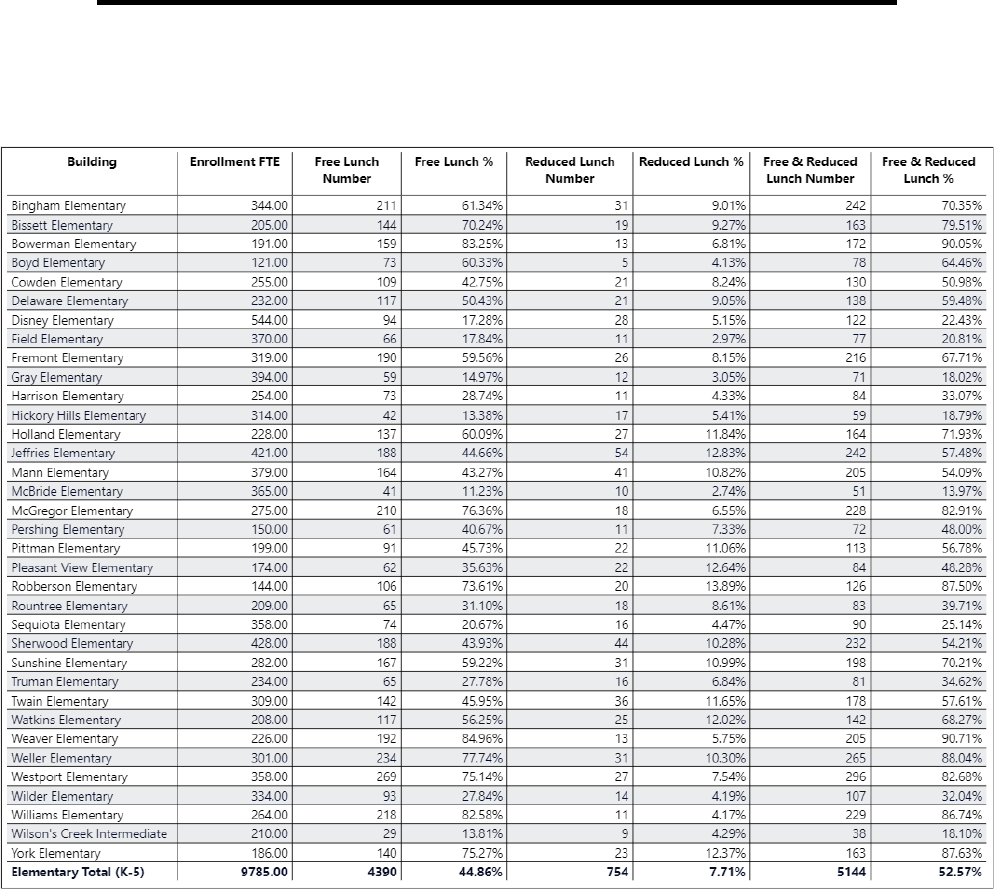
34
FREE & REDUCED LUNCH INFORMATION
FREE & REDUCED LUNCH: ELEMENTARY
2021-2022
Due to rounding, percentage totals may show a variance of up to 0.1 percent.
Enrollment Full Time Equivalent (FTE) – Resident students in grades K-12 counted the last Wednesday in January who are enrolled on
count day and in attendance at least 1 of the 10 previous school days. The average scheduled hours per week divided by the total possible
hours a student could attend in a week.
Source: 2022 February Student Core File (data as of 10/09/2022), Missouri Student Information System (MOSIS) data collection/reporting

35
FREE & REDUCED LUNCH: SECONDARY
2021-2022
Due to rounding, percentage totals may show a variance of up to 0.1 percent.
Enrollment Full Time Equivalent (FTE) – Resident students in grades K-12 counted the last Wednesday in January who are enrolled on
count day and in attendance at least 1 of the 10 previous school days. The average scheduled hours per week divided by the total possible
hours a student could attend in a week.
Source: 2022 February Student Core File (data as of 10/09/2022), Missouri Student Information System (MOSIS) data collection/reporting

36
SPECIAL PROGRAMS
PARTICIPATION IN SPECIAL PROGRAMS
2021-2022
Source: 2022 December Student Core File (data as of 08/04/2022) and 2022 June Student Core File (data as of 11/13/2022), Missouri
Student Information System (MOSIS) data collection/reporting, SPS Parents as Teachers, and SPS Office of Secondary Learning
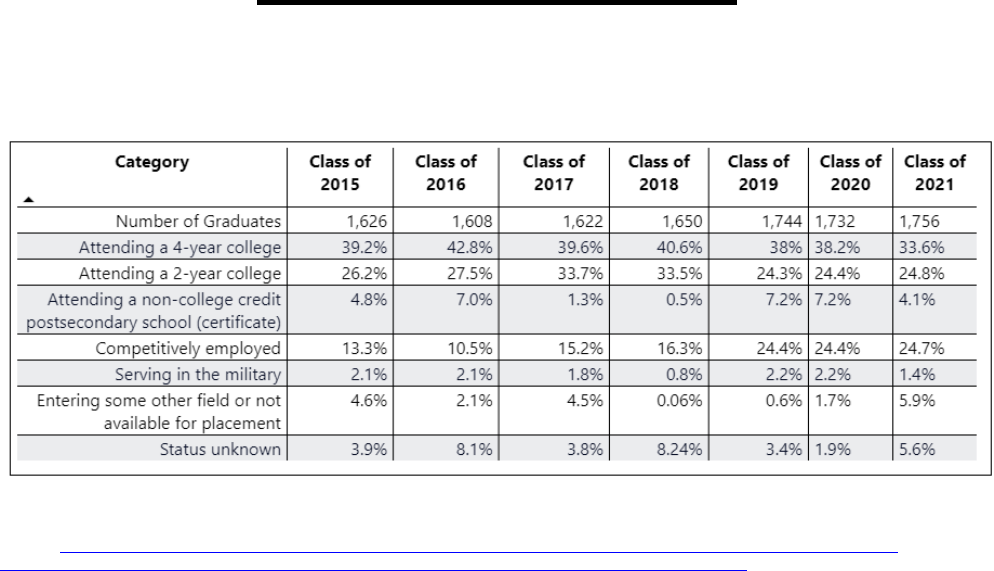

38
OTC GRADUATE FOLLOW-UP
STUDENTS WHO COMPLETED CAREER EDUCATION PROGRAMS
AT OZARKS TECHNICAL COMMUNITY COLLEGE (OTC) WHILE IN HIGH SCHOOL:
CLASS OF 2019, 2020 & 2021
Source: OTC Career Center, Ozarks Technical Community College

39
MISSOURI SCHOOL IMPROVEMENT PROGRAM (MSIP) 6
View 2021-2022 MSIP6 results for Springfield Public Schools. Click Here
The sixth version of the Missouri School Improvement Program (MSIP 6), the state’s accountability
system for reviewing and accrediting public school districts, is focused on continuous improvement for
all schools, the preparation of each student for life beyond high school, and promoting practices that
lead to healthy school systems. MSIP 6 will take a closer look at what districts are doing to implement
effective practices and sustain improvements, while increasing the focus on individual student growth.
The comprehensive MSIP accountability system was established in 1990 and has evolved with each
version. After more than two years of discussion, work, and review by educators and practitioners
around the state, the State Board of Education approved the MSIP 6 Standards and Indicators in
February 2020. These Standards and Indicators are designed to establish a new method for the state
to determine the extent to which students are meeting the Missouri Learning Standards and obtaining
necessary skills and knowledge. During this two-year period, over 6,000 comments were received
from stakeholders including teachers and administrators.
MSIP 6 is intended to distinguish the performance of schools and districts in valid, accurate, and
meaningful ways so that districts can continue to improve and identify areas of excellence. To this
end, the Missouri Department of Elementary and Secondary Education (DESE) will produce an
Annual Performance Report (APR) for districts and schools across the state, which will be used to
inform accreditation and classification decisions. Indicators evaluated on the MSIP 6 APR are divided
into two sections: Performance metrics, which measure student outcomes, and Continuous
Improvement metrics, which assess the quality of the work of the LEA toward improving the
opportunities provided to all students.
As of the publication of this report, the 2022 APR and supporting data have not been made available
to districts or the public.
Sources: MSIP6 Comprehensive Guide 2022, Missouri Department of Elementary & Secondary Education
Administrative Memo to School Administrators dated November 3, 2022, Missouri Department of Elementary and Secondary Education

40
CONTINUOUS IMPROVEMENT PLAN
SPRINGFIELD PUBLIC SCHOOLS STRATEGIC PLAN
Educational reform efforts over the past decade have highlighted the need for public education to
produce and showcase quantifiable results on tests and other measures of achievement. Research
literature indicates that educational performance is heightened when individuals understand what is to
be measured and why. Such a process is commonly referred to as “accountability.” An accountability
process that measures progress is a good tool, but it cannot be an end unto itself—it must result in
improvements. Research indicates customers of educational systems are interested in how students
and schools are performing and improving, and finding out what promotes student learning.
The accountability goal of the Springfield Public School District is to systematically set goals, define
strategies to reach those goals, and monitor progress in achieving goals. The commitment of
Springfield Public Schools to continuous improvement is reflected in the accountability process. A
comprehensive accountability process provides continuous feedback to help school leaders
systematically investigate which elements help school professionals and students perform more
effectively.
The school district has four priority areas:
1. Success-Ready Students
2. Organizational Efficiency
3. Collaborative Culture
4. Quality Learning Environments
The district has also identified performance indicators critical to meeting district goals that are
embedded within each of the aforementioned focus areas. These indicators help the district know
what must be done to be considered successful by the public it serves. To accomplish this end,
performance measurements have been established to ensure expectations are met and ensure the
district’s commitment to continuous improvement.

41
FINANCIAL DATA
FINANCIAL OVERVIEW & COMPARISON
2020-2021 and 2021-2022
Average Per-Pupil Expenditure
3
Average per pupil expenditure is calculated by taking the current expenditure (as defined by
Section 163.011 RSMo), divided by the average daily attendance (including summer school)
of residential students.
Year
Per-Pupil Expenditure
Federal
State/Local
Total
Springfield District 2020-2021 $885 $9,501 $10,387
State 2020-2021 $1,407 $10,734 $12,141
Springfield District 2021-2022 $2,163 $9,900 $12,063
State 2021-2022 $1,938 $11,217 $13,155
Adjusted Tax Rates
Year
General
Fund
Special
(Teachers)
Fund
Debt
Service
Capital
Projects
Springfield District 2020-2021 $1.9485 $1.5942 $0.7300 $0.0000
State 2020-2021 $3.4922 $0.1197 $0.4912 $0.0873
Springfield District 2021-2022 $1.8392 $1.5048 $0.7300 $0.0000
State 2021-2022 $3.4200 $0.1011 $0.5060 $0.1168
Assessed Valuation (per Missouri Department of Elementary and Secondary Education)
2017-2018
2018-2019
2019-2020
2020-2021
2021-2022
$3,601,528,129 $3,648,027,894 $3,858,827,635 $3,863,596,529 $4,117,956,502
Operating Revenue
2020-2021
2021-2022
Local
60.45%
56.71%
State
25.43%
25.59%
Federal
14.12%
17.70%
Total
100%
100%
Source: Missouri Department of Elementary and Secondary Education MCDS Portal > Report Card > Report Card and SPS Business
Services
Monetary expenditures were not available through DESE at the time of publication.


44
EARLY CHILDHOOD SPECIAL EDUCATION
EDUCATIONAL ENVIRONMENT
2021-2022
In December 2006, the Office of Special Education Programs (OSEP) made changes to data
collection requirements for children with disabilities in Early Childhood Special Education
(ECSE). The ECSE program now reports the “total educational environment” for each identified
child in the program. Following is the listing of educational environments which are used in state
reporting. (These educational environments do not replace the placement decisions made by
the IEP team and documented on the IEP).
Students
Educational
Environment
Description
12
Regular Early
Childhood (EC)
Program
In EC program 10+ hours and received majority of SPED
services in regular program.
91
Regular Early
Childhood Program
In EC program 10+ hours and received majority of SPED
services in another location.
1
Regular Early
Childhood Program
In EC program fewer than 10 hours and received majority of
SPED services in regular program.
1
Regular Early
Childhood Program
In EC program fewer than 10 hours and received majority of
SPED services in another location.
175
Separate class
Children with disabilities who attend a special education
program in a class with less than 50% nondisabled children.
(Do not include children who also attend a regular early
childhood program.)
0
Separate School
Children with disabilities who receive special education and
related services in public or private day schools designed
specifically for children with disabilities. (Do not include children
who also attend a regular early childhood program.)
0
Residential Facility
Children with disabilities who receive special education and
related services in publicly or privately-operated residential
schools or residential medical facilities on an inpatient basis.
(Do not include children who also attend a regular early
childhood program.)
4
Home
Children with disabilities who receive SPED and related
services in the principal residence of the child’s family or
caregivers, and who did not attend an early childhood program
or a SPED program provided in a separate class, school, or
residential facility. Includes children who received special
education both at home and in a service provider location. The
term caregiver includes babysitters.
7
Service Provider
Location
Children with disabilities who receive all of their SPED and
related services from a service provider, and who did not attend
an early childhood program or a special education program
provided in a separate class, school, or residential facility. Does
not include children who also receive special education at
home. Children who receive special education both in a service
provider location and at home are reported in the “Home”
category.
* Indicates the number has been suppressed due to cell size.
Source:
Missouri Department of Elementary and Secondary Education MCDS Portal > Special Education > Special Education
Profiles

45
GRADE DISTRIBUTION SUMMARY: HIGH SCHOOL
2021-2022
Source: 2022 June Course Completion File (data as of 11/09/2022), Missouri Student Information System (MOSIS) data
collection/reporting

46
DISCIPLINARY ACTIONS
2021-2022
ISS: In-school suspension
OSS: Out-of-school suspension
Source: 2022 June Student Discipline File (data as of 07/01/2022), Missouri Student Information System (MOSIS) data
collection/reporting
