Reasons for Discontinuing
and not Intending to Use
Contraception in India
Vinod K. Mishra, Robert D. Retherford,
P. S. Nair, and Griffith Feeney
National Family Health Survey Subject Reports
Number 13 • June 1999
International Institute for Population Sciences
Mumbai, India
East-West Center, Population and Health Studies
Honolulu, Hawaii, U.S.A.

Correspondence addresses:
International Institute for Population Sciences
Govandi Station Road, Deonar, Mumbai - 400 088, India
East-West Center, Population and Health Studies
1601 East-West Road, Honolulu, Hawaii 96848-1601, U.S.A.
India’s National Family Health Survey (NFHS) was conducted in 1992–93 under the auspices
of the Ministry of Health and Family Welfare. The survey provides national and state-level
estimates of fertility, infant and child mortality, family planning practice, maternal and child
health, and the utilization of services available to mothers and children. The International
Institute for Population Sciences, Mumbai, coordinated the project in cooperation with 18
population research centres throughout India, the East-West Center in Honolulu, Hawaii, and
Macro International in Calverton, Maryland. The United States Agency for International
Development provided funding for the project.
ISSN 1026-4736
This publication may be reproduced for educational purposes.
Reasons for Discontinuing
and not Intending to Use
Contraception in India
Abstract
.
Based on data from India’s 1992–93 National Family Health Survey, this
study analyzes the main reasons for discontinuing contraceptive use and for not
intending to use contraception in the future. The study also analyzes the effects of
seven demographic and socioeconomic variables on reported reasons for discon-
tinuing contraception or intending not to use contraception.
The results indicate that 38% of currently married women age 13–49 who dis-
continued using contraception did so because of a method-related problem or method
failure. Comparing states, the proportion who discontinued because of a method-
related problem or method failure ranges widely—from 11% in Meghalaya to 94% in
Nagaland. It is not highly correlated with state-level fertility. By contrast, the propor-
tion reporting a method-related problem or method failure as their main reason for
discontinuing contraception does not vary widely across socioeconomic groups, ei-
ther within individual states or in India as a whole.
In the country as a whole, 15% of women who do not use contraception and
who do not intend to use contraception in the future report method-related problems
as their main reason for not intending to use contraception, while 9% mention oppo-
sition to family planning. The proportion reporting method-related problems or oppo-
sition to family planning is particularly high among women in the prime reproductive
ages and among women not regularly exposed to electronic mass media. The pro-
portion reporting opposition to family planning is several times higher among Muslim
women than among Hindu women or women of other religions. The estimated effects
of age, media exposure, and religion are largely independent of other, potentially
confounding, socioeconomic variables.
Only 1% or less of women mention accessibility or cost as their main reason for
discontinuing contraception or not intending to use contraception in the future. Simi-
larly, very few women mention replacing a dead child as a reason for discontinuing
contraception.
The finding that method-related problems and method failure are important rea-
sons for discontinuing contraception and the finding that method-related problems
and opposition to family planning are important reasons for not intending to use con-
traception in the future suggest that the quality of family planning services in India

4
National Family Health Survey Subject Reports, No. 13
needs improvement. These findings also suggest the importance of education and
motivation activities. Programmes should pay particular attention to women in those
states and social categories in which the proportions mentioning method-related prob-
lems and opposition to family planning are especially high.
Vinod K. Mishra, Robert D. Retherford, P. S. Nair, and Griffith Feeney
Vinod K. Mishra is a Fellow, Robert D. Retherford is Coordinator of Population and
Health Studies, and Griffith Feeney is a Senior Fellow at the East-West Center, Ho-
nolulu. P. S. Nair is Director of the Population Research Centre, Thiruvananthapuram.
National Family Health Survey Subject Reports, Number 13 • June 1999

5
National Family Health Survey Subject Reports, No. 13
INTRODUCTION
It is well documented that effective family planning programmes can minimize
unintended pregnancies, reduce maternal mortality, and improve child survival
(Population Reference Bureau 1998; Winikoff and Sullivan 1987; Choe et al. 1999).
To be successful, however, family planning programmes must motivate women to
begin using contraception and must encourage women who are already using family
planning not to discontinue contraceptive use. This report analyzes women’s reasons
for discontinuing contraception and not intending to use contraception in the future,
based on data from India’s 1992–93 National Family Health Survey (NFHS). It also
analyzes the effects of seven demographic and socioeconomic variables on women’s
reported reasons for discontinuing and not intending to use contraception.
Through the years, India’s family planning programme has focused primarily
on sterilization. Both programme targets and performance evaluations have
emphasized numbers of sterilizations performed. For this reason, there has been
little incentive for programme managers or field workers to promote temporary
contraceptive methods, such as pills or condoms. Discontinuation rates for temporary
methods have been high, in no small part because of the poor quality of services
offered for these methods. Thus programme priorities account in large part for both
the low prevalence and the high discontinuation rates for temporary contraceptive
methods.
Low prevalence and high discontinuation rates help to explain the low impact
of temporary methods on fertility in India compared with the importance of these
methods in many other countries (Jejeebhoy 1989). The relative neglect of temporary
methods also has an impact on health. Because of the emphasis on sterilization, most
Indian couples think of family planning as a means of stopping childbearing rather
than as a means of spacing births, even though birth spacing can be beneficial to the
health of both mother and child (Rajaretnam and Deshpande 1994).
This situation has changed somewhat in recent years. The top-down targets for
family planning have been officially abandoned, and the government has been making
greater efforts to promote temporary methods (Narayana 1998). Under the new
approach, community needs and participation are given high priority in providing
family planning services (Ministry of Health and Family Welfare 1998a), and the
government is making efforts to increase the supply of temporary methods through a
variety of sources. As a consequence, there has been some shifting toward temporary
methods (Ministry of Health and Family Welfare 1998b).
The most commonly cited reasons for contraceptive discontinuation and non-
use in India and other developing countries include: quality, accessibility, and cost
of family planning services; side effects (either experienced by a woman herself or
by other women she knows); fear of a particular method or health reasons for not

6
National Family Health Survey Subject Reports, No. 13
using a method; desire for more children; a woman’s perception that she is already
sterile or in menopause; and opposition to family planning for religious or other
reasons. Misconceptions about contraceptive use and a negative image of the family
planning programme are also sometimes mentioned as reasons for discontinuation
and non-use.
Research in other countries provides a basis for comparison with the situation
in India. A study in Nigeria found that 35% of married women of reproductive age
who were not using family planning reported that they were not using contraception
because they themselves or someone they knew had encountered a method-related
problem or had fears associated with the use of contraception. In the same study,
another 31% of the women reported that their husbands were opposed to family
planning (Fakeye and Babaniyi 1989). In examining religious beliefs about
contraception among Muslims and beliefs about the possible health hazards of oral
contraceptives, Fakhr El-Islam et al. (1988) found that religious beliefs and beliefs
about health risks are mutually reinforcing.
A recent qualitative study conducted in rural Nepal indicated that poor
knowledge and misconceptions are important reasons for low use of family planning
(Sturley 1998). In a comparative study of IUD and pill use in Tunisia and Morocco
based on Demographic and Health Survey data, Esseghairi et al. (1991) found that
urban/rural residence and source of supply are strong correlates of both method failure
and method discontinuation. In Bangladesh, Ahmed et al. (1990) found an association
between source of supply and patterns of condom use and discontinuation. On the
whole, these studies suggest that method-related problems are important reasons for
contraceptive discontinuation and non-use. However, the relative importance of
different kinds of method problems varies from country to country.
In India, several studies have reported lack of knowledge, misconceptions,
inaccessibility, and cost as reasons for not using family planning. In an early study in
Uttar Pradesh, Simmons et al. (1971) found that women who knew about family
planning mentioned cost, fear of side effects, and shame as important reasons for not
using contraception. In a qualitative study conducted 20 years later in rural Uttar
Pradesh, Levine et al. (1992) found that perceptions that family planning services
were of poor quality and concerns about method problems were important reasons
for non-use. In a prospective study of temporary method users, Gandotra and Das
(1990) found that discomfort, side effects or fear of side effects, physical complaints,
method failure or fear of method failure, need for a safer method, and need for a
more permanent method accounted for most instances of discontinuation and method
switching.
A follow-up study of IUD acceptors in Mysore found very high rates of
discontinuation, primarily because of excessive bleeding, pain/discomfort/ill health,
white discharge, expulsion, method failure, or opposition from others (Prabhavathi

7
National Family Health Survey Subject Reports, No. 13
and Sheshadri 1988). Another study, based on several follow-up evaluation surveys
of IUD acceptors in various parts of Karnataka, also reported high rates of
discontinuation, primarily due to side effects (Population Research Centre, Dharwad
1991). In a study conducted in two districts of rural south India, both programme
officers and field workers reported that many couples do not use temporary methods
because they fear side effects, find the methods inconvenient, or experience opposition
from others (Rajaretnam and Deshpande 1994). Respondents also mentioned a lack
of incentives to promote temporary methods because the performance of family
planning field workers was evaluated primarily in terms of numbers of sterilization
acceptors. A study conducted in low-income areas of Delhi noted side effects and
method dissatisfaction as primary causes of contraceptive discontinuation (Talwar et
al. 1986).
Socioeconomic and demographic variables that may be related to women’s
reason for contraceptive discontinuation or non-use include woman’s age, number
and sex of living children, experience of child death, urban/rural residence, religious
affiliation, and woman’s education, occupation, and exposure to mass media. Using
data from the 1992–93 National Family Health Survey (NFHS), Ramesh et al. (1996)
and Retherford and Mishra (1997) showed the effects of these variables on
contraceptive use, and Nair et al. (1999) showed their effects on sources of supply of
family planning. The analysis presented here evaluates the effects of these variables
on women’s reasons for contraceptive discontinuation and intention not to use
contraception in the future.
DATA AND METHODS
Most studies of contraceptive discontinuation and non-use in India have been based
on small surveys that cover only limited areas of the country. This study, based on
India’s 1992–93 National Family Health Survey (NFHS), provides the first compre-
hensive, national-level analysis of women’s reasons for contraceptive discontinua-
tion and non-use.
The NFHS collected data from a nationally representative sample of 89,777
ever-married women age 13–49, living in 88,562 households. The survey covered 25
states (including Delhi, which recently attained statehood). The sample size varied
from state to state, ranging from about 1,000 in each of six small northeastern states
to more than 11,000 in Uttar Pradesh, which is India’s most populous state. In some
states the sample design was self-weighting, and in others certain categories of re-
spondents (for example, those in urban areas) were over-sampled. Analysis of data
from these states requires weights to restore the correct proportions. Tabulations at
the national level require a different set of weights because the sampling fraction
varies from state to state. Thus each woman in the NFHS has two sets of weights—

8
National Family Health Survey Subject Reports, No. 13
one that is used when the state is the unit for tabulation and the other when tabulation
is for the whole country. The analysis in this report is based on the weighted data.
The survey reports for India (IIPS 1995) and for individual states discuss the sample
design for the NFHS in more detail.
The NFHS included a series of questions on contraceptive use. The survey
asked currently married women who were not currently pregnant, had at some time
used contraception, but were not currently using any method the main reason why
they had discontinued using contraception. The numbers responding to this question
are small, primarily because most Indian couples who use contraception rely on
sterilization, in which case there can be no discontinuation. In addition, the NFHS
does not provide any information on past discontinuation of family planning among
current users or among women who were pregnant at the time of the interview. Nei-
ther does the survey provide information on the timing of past periods of contracep-
tive use, which would allow the calculation of life-table statistics on discontinuation.
These data limitations necessarily restrict the scope of any analysis of contraceptive
discontinuation.
Currently married women who were not using contraception at the time of the
survey, comprising slightly more than half of the sample, were asked whether they
intended to use contraception in the future. Those who answered that they did not
intend to use contraception, comprising just under one-third of the sample, were
asked their primary reason for not intending to use contraception. The survey does
not provide any information, however, on why women were not using contraception
at the time of the interview. In particular, there is no information on why women who
said that they intended to use family planning in the future were not using contracep-
tion at the time of the survey. This analysis of non-use is limited to those women who
were not using contraception at the time of the survey and who said that they did not
intend to use contraception in the future.
‘Main reason for discontinuation’ and ‘main reason for not intending to use
contraception in the future’ are the two response variables used in this report. For
purposes of multivariate analysis, reasons for contraceptive discontinuation are
grouped into three broad categories: ‘wanted child’, ‘method problem or failure’,
and ‘other’. Reasons for not intending to use contraception in the future are grouped
into four broad categories: ‘wants more children’, ‘cannot have children’, ‘method
problem’, and ‘opposition to family planning’. Since wanting more children and
intending to use contraception in the future (after having had the wanted children)
are not incompatible, some of the respondents who supplied these answers may have
effectively evaded the question on reasons for not intending to use contraception in
the future.
The NFHS also collected information on various demographic and socioeco-
nomic characteristics that can affect a woman’s reasons for discontinuing contracep-

9
National Family Health Survey Subject Reports, No. 13
tion or not intending to use contraception in the future. The variables selected for
this analysis are: woman’s age (13–24, 25–34, 35–49); residence (urban, rural); edu-
cation (illiterate, literate but less than middle school complete, middle school com-
plete or higher); religion (Hindu, Muslim, other); caste/tribe (scheduled caste or
scheduled tribe, other)
1
; exposure to electronic mass media (regularly exposed, not
regularly exposed)
2
; and geographic region (north, central, east or northeast, west, south).
The analysis includes these predictor variables because they are known to have
substantial effects on contraceptive use (Ramesh et al. 1996) and are likely to affect
discontinuation and intention not to use contraception as well. Contraceptive use
and method choice are known to depend on a woman’s age, suggesting that a woman’s
reasons for discontinuation are also likely to change with age. A young woman is
likely to discontinue contraception because she wants more children, while an older
woman is likely to discontinue because of menopause. A woman’s reasons for not
intending to use contraception in the future are also likely to vary with age.
Urban women usually have better access than do rural women to contracep-
tion, to information about contraception, and to healthcare providers in case they
have a problem using contraception. For these reasons, urban/rural residence is likely
to affect both discontinuation and intention to use contraception. A woman’s level of
education is likely to affect her knowledge of contraceptive methods and side ef-
fects, her preconceptions about family planning, and a host of other factors that may
influence discontinuation or intention not to use contraception. Contraceptive
use and method choice also vary widely by religion. Muslims are less likely to
use contraception than are Hindus. If they use contraception, they are more likely
than Hindus to use temporary methods, and if they do not use contraception,
they are more likely than Hindus to give religious opposition as the reason (Mishra
1999).
Women who belong to scheduled castes or tribes tend to have poorer access to
family planning services and lower acceptance rates than other women. They may
also have cultural practices and beliefs that affect discontinuation and intention to
use contraception. Exposure to electronic mass media substantially affects both cur-
rent contraceptive use and intentions for future use (Retherford and Mishra 1997).
Finally, region is included in the analysis because family planning acceptance in
1. Scheduled castes (SC) and scheduled tribes (ST) are those castes and tribes identified by
the Government of India as socially and economically disadvantaged and in need of protec-
tion from social injustice and exploitation.
2. A woman is categorized as regularly exposed to electronic mass media if she listens to
radio or watches television at least once a week or goes to a cinema hall or theatre to see a
movie at least once a month.

10
National Family Health Survey Subject Reports, No. 13
India varies widely by region. Reasons for discontinuation and intention not to use
contraception are likely to vary by region as well.
This report comprises two sections. The first discusses the effects of the seven
demographic and socioeconomic characteristics on reasons for discontinuing con-
traceptive use, and the second discusses the effects of these variables on reasons for
not intending to use contraception in the future. Because both response variables are
categorical with more than two categories, all analysis is based on multinomial lo-
gistic regression. To make the results more accessible to non-statisticians, they are
transformed via multiple classification analysis into simple bivariate tables and fig-
ures (Retherford and Choe 1993). The underlying multinominal logistic regression
coefficients are not shown.
Both unadjusted and adjusted effects of the predictor variables are estimated.
The unadjusted effects of each predictor variable are calculated from a separate mul-
tinomial logistic regression. Thus, each set of unadjusted percentages pertaining to a
specific predictor variable corresponds to a separate regression based on only that
one predictor variable. The adjusted percentages, by contrast, are predicted from a
single multinomial logistic regression that includes all seven predictor variables. In
calculating adjusted percentages for any given predictor variable, the other six vari-
ables, treated as controls, are held constant by setting them to their mean values.
Thus the set of controls changes for each predictor variable under consideration. In
the calculation of both unadjusted and adjusted percentages, each multinomial logis-
tic regression is calibrated by resetting the values of the constant terms in the estimated
equations so that the predicted percentages obtained when all predictor variables are set
to their mean values equal the observed percentages calculated directly from the data.
CONTRACEPTIVE DISCONTINUATION
In previous studies, women in India have indicated three main reasons for
discontinuing contraceptive use: (1) wanting to become pregnant, (2) becoming
pregnant because of method failure or improper use of a method, or (3)
experiencing side effects or some other problem with a method. Other reasons
for discontinuation mentioned less frequently include difficulty in obtaining a
method, separation from spouse, onset of poor health, and changing perceptions
of fecundity (e.g., the woman may believe that she is menopausal and no longer
at risk of becoming pregnant).
In the NFHS, non-pregnant women who had previously used a family
planning method but were not using any method at the time of the survey were
asked the main reason why they had stopped using contraception. The reason
given for contraceptive discontinuation is assumed to refer to the most recent
discontinuation and the most recent method used.

11
National Family Health Survey Subject Reports, No. 13
Table 1 gives a general indication of the frequency of discontinuation and
method switching among ever-married women age 13–49, based on their reports
of the number of methods ever used. Among all women who have ever used
contraception, 25% have used more than one method. Inasmuch as sterilization
precludes the need to use any other method, it is not surprising that women who
are sterilized have used fewer methods than women who have used temporary
methods. Among women who are sterilized, less than 18% have ever used any
other method. By contrast, more than 60% of women who have ever used IUD,
pill, condom, injection, periodic abstinence, or withdrawal have also used another
method, indicating substantial discontinuation and switching among temporary
methods. The NFHS did not ask women if there was a time lag between
discontinuing one method and starting another, so that it is not possible to
distinguish between discontinuation and switching in Table 1.
The last column in Table 1 shows the mean number of methods used. The
means are calculated from the full distribution, which extends to as many as
seven methods used, rather than from the truncated distributions shown in the
table. Overall, the mean number of methods used is only 1.3, reflecting the high
proportion of women who have used sterilization as their first and only method.
Women currently using temporary methods have used between two and three
methods on average.
Reported reasons for discontinuing contraception
Table 2 and Figure 1 show the distribution of women according to their main reason
for discontinuing contraception, both for the whole country and for urban and rural
Table 1 Distribution of ever-married women age 13–49 who have ever used contraception by type and
number of methods ever used, India: NFHS, 1992–93
Mean
Number of methods ever used Total number
number of methods
Type of method ever used 1 2 3 4+ of women ever used
Male sterilization 84 12 3 1 3,131 1.2
Female sterilization 82 13 4 2 24,020 1.3
IUD 39 36 16 9 4,366 2.0
Pill 31 36 21 12 4,580 2.2
Condom 34 34 21 11 6,172 2.1
Injection 20 31 22 27 178 2.7
Periodic abstinence 31 41 19 9 7,593 2.1
Withdrawal 18 42 27 13 4,685 2.4
Other 42 30 13 15 706 2.0
All women 75 17 6 2 41,167 1.3
Note:
In this and subsequent tables, percentages and numbers of women are based on the weighted samples.

12
National Family Health Survey Subject Reports, No. 13
Table 2 Main reason for discontinuing contraception among currently married, non-pregnant, non-
sterilized women (whose husbands were also not sterilized) age 13–49 who had previously used
contraception but were not using contraception at the time of the survey, by residence, India: NFHS,
1992–93
Percentage giving specific reason
Reason Total Urban Rural
Wanted child 28.9 24.9 31.0
Wanted to have a child 28.4 24.7 30.3
Wanted to replace dead child 0.5 0.2 0.7
Method problem or failure 37.8 43.5 34.9
Created health problem 14.6 20.2 11.6
Created menstrual problem 6.6 7.6 6.0
Method failed/got pregnant 5.3 3.4 6.4
Did not like the method 4.0 3.8 4.1
Inconvenient to use 2.7 3.6 2.2
Lack of sexual satisfaction 1.8 1.4 2.1
Lack of privacy for use 1.4 2.2 1.0
Hard to get method 1.0 0.7 1.2
Put on weight 0.4 0.6 0.3
Other 33.3 31.7 34.1
Other 31.0 29.1 32.0
Don’t know 2.3 2.6 2.1
Total percent 100.0 100.0 100.0
Number of women 4,180 1,462 2,718
areas separately. The distribution is based on currently married, non-pregnant, non-
sterilized women age 13–49 who had previously used contraception but were not
using any method at the time of the survey. In India as a whole, 29% of this group
discontinued because they wanted to have a child, 38% because of a method prob-
lem or failure, and 33% for some other reason. Only 0.5% of these women reported
that they discontinued family planning because they ‘wanted to replace a dead child’,
indicating that replacement of dead children is of negligible importance in explain-
ing contraceptive discontinuation.
The 38% who discontinued because of a method problem or failure can be
further broken down as follows: 15% discontinued because the method created a
health problem, 7% because it created a menstrual problem, and 5% because the
method failed or the woman got pregnant. Another 11% discontinued because of
some other method problem, including ‘did not like the method’, ‘inconvenient to
use’, ‘lack of sexual satisfaction’, ‘lack of privacy for use’, ‘hard to get method’, or
‘put on weight’. Only 1% discontinued primarily because it was ‘hard to get method’,
indicating that inaccessibility of family planning services is not a serious problem,
at least not among family planning acceptors.
Women also mentioned the onset of menopause and absence of their husbands
as reasons for discontinuing contraception, although these are not specified as distinct
responses but rather are lumped into the ‘other’ category. Of all the women responding
13
National Family Health Survey Subject Reports, No. 13
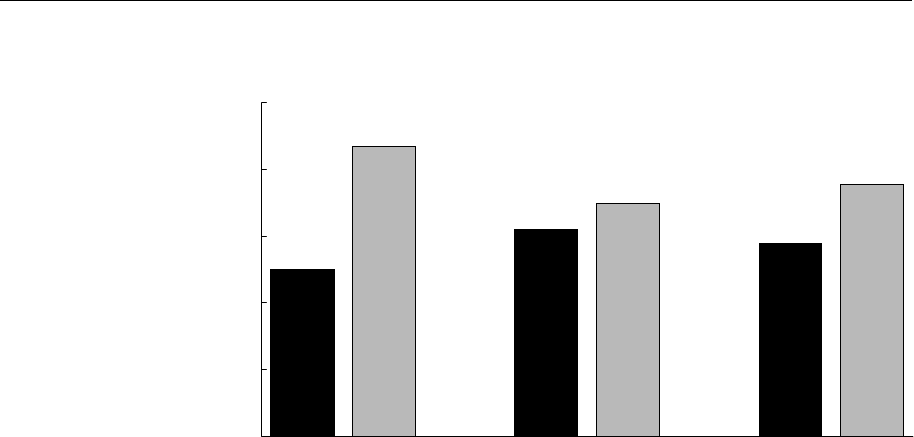
Figure 1 Major reasons for discontinuing contraception, by residence, India: NFHS,
1992–93
to this question, 31% mentioned a reason for discontinuing other than the specific
reasons given in Table 2, and 2% did not know or did not answer the question.
The percentage of women who report ‘wanted to have a child’ as their main
reason for discontinuing contraception is somewhat higher in rural areas (30%) than
in urban areas (25%), consistent with a larger desired family size and higher fertility
in rural areas. The percentage reporting ‘wanted to replace dead child’ is also higher
in rural areas, consistent with higher child mortality and higher fertility in rural
areas. A considerably larger proportion of women in urban areas report ‘created
health problem’ as their main reason for contraceptive discontinuation. This may
reflect greater health consciousness among urban women. The percentage reporting
‘created menstrual problem’ is also higher in urban areas than in rural areas.
Table 3 and Figure 2 show reasons for discontinuing contraception by state.
The table and figure report only three aggregated categories: ‘wanted child’, ‘method
problem or failure’, and ‘other’. There is considerable variation by state in the
proportion of women giving these three reasons for contraceptive discontinuation.
The proportion citing ‘wanted child’ ranges from 6% in Nagaland to 46% in Gujarat
and 50% in Meghalaya. (The proportion in Meghalaya is based, however, on fewer
than 50 cases and is therefore subject to considerable sampling variability.) The
proportion citing ‘other’ reasons ranges from 0% in Nagaland to 50% or more in
Delhi, Jammu, Assam, Tripura, Goa, and Kerala. The reasons for such large variability
among states are not clear.
Among women who report ‘other’ reasons for discontinuing contraception, many
probably discontinued because their husbands were away or because they perceived
25
44
31
35
29
38
0
10
20
30
40
50
Wanted
child
Method
problem or
failure
Wanted
child
Method
problem or
failure
Wanted
child
Method
problem or
failure
Percentage giving specific reason
for discontinuation
Urban Rural Total

14
National Family Health Survey Subject Reports, No. 13
that they had become infecund. This is certainly the case in Kerala, where ‘husband
absent’ and ‘menopausal/had hysterectomy’ are separated out from the ‘other’ category
and coded as separate categories. (These categories are separated in Kerala but not in
other states because temporary separations due to husbands working in the Middle
East are very common in Kerala.) Table 3 shows that in Kerala 55% of all women
who have discontinued contraception report that they discontinued for ‘other’ reasons.
Out of this 55%, 36% report ‘husband absent’, and another 7% report ‘menopausal/
had hysterectomy’ as their main reason for discontinuation. Thus, in Kerala about
four-fifths of the ‘other’ responses in Table 3 are accounted for by ‘husband absent’
and ‘menopausal/had hysterectomy’ (Population Research Centre, Thiruvanan–
thapuram 1995).
Table 3 Main reason for discontinuing contraception among currently married, non-pregnant, non-
sterilized women (whose husbands were also not sterilized) age 13–49 who had previously used
contraception but were not using contraception at the time of the survey, by state: NFHS, 1992–93
Percentage giving specific reason
Method problem
State Wanted child or failure Other Number of women
India 29 38 33 4,180
North
Delhi 16 28 56 279
Haryana 41 33 26 165
Himachal Pradesh 33 24 43 207
Jammu region of Jammu and Kashmir 29 19 52 162
Punjab 28 23 49 192
Rajasthan 44 36 21 121
Central
Madhya Pradesh 26 48 26 237
Uttar Pradesh 27 48 25 556
East
Bihar 36 41 24 135
Orissa 17 60 23 133
West Bengal 20 33 47 390
Northeast
Arunachal Pradesh 29 63 9 35
Assam 28 22 50 414
Manipur 15 71 14 72
Meghalaya 50 11 39 46
Mizoram (26) (63) (11) 19
Nagaland 6 94 0 53
Tripura 36 14 50 107
West
Goa 24 22 54 221
Gujarat 46 40 14 147
Maharashtra 35 45 20 139
South
Andhra Pradesh 38 35 27 79
Karnataka 41 39 21 175
Kerala 25 20 55 352
Tamil Nadu 28 46 26 194
( ) Percentage based on fewer than 25 unweighted cases.

15
National Family Health Survey Subject Reports, No. 13
Figure 2 Reasons for discontinuing contraception (percentage distribution by
reason), by state: NFHS, 1992–93
0% 10% 20% 30% 40% 50% 60% 70% 80% 90% 100%
Me
g
hala
y
a
Gu
j
arat
Ra
j
asthan
Har
y
ana
Karnataka
Andhra Pradesh
Tripura
Bihar
Maharashtra
Himachal Pradesh
Arunachal Pradesh
Jammu re
g
ion
Assam
Tamil Nadu
Pun
j
ab
Uttar Pradesh
Mizoram
Madh
y
a Pradesh
Kerala
Goa
West Ben
g
al
Orissa
Delhi
Manipur
Na
g
aland
Wanted child Method problem or failure Other
Percenta
g
e discontinuin
g
for specific reason

16
National Family Health Survey Subject Reports, No. 13
The proportion reporting ‘method problem or failure’ is interesting from a policy
point of view, because with improvement in service quality many of these women
might be persuaded to resume contraception or to avoid discontinuation in the first
place. Table 3 shows that the proportion reporting ‘method problem or failure’ varies
considerably by state. In Orissa, Arunachal Pradesh, Manipur, Mizoram, and
Nagaland, 60% or more of women who have discontinued contraception give ‘method
problem or failure’ as their main reason. In Madhya Pradesh and Uttar Pradesh, two
large states in central India, 48% of these women report ‘method problem or failure’.
Factors affecting reasons for discontinuation
Table 4 gives definitions and mean values of the variables potentially associated
with specific reasons for contraceptive discontinuation, both for India as a whole
and for urban and rural areas separately. Because all variables are categorical, the
mean value for a category of a given variable is the same as the proportion of women
falling in that category. The table presents these proportions as percentages. The
means of the response variables have already been discussed. The means of the
predictor variables show the distribution among the categories of each variable of
currently married, non-pregnant, non-sterilized women (whose husbands were also
not sterilized) who have discontinued using contraception.
The women who have discontinued contraception are somewhat concentrated
in the 25–34 age group, apparently because use of temporary methods—and thus the
possibility of discontinuation—is greatest in this age group. Thirty-five percent of
women who have discontinued contraception live in urban areas, substantially higher
than the urban proportion (26%) of all currently married women in the NFHS sample.
This difference reflects both higher contraceptive prevalence and greater use of
temporary methods in urban areas. For similar reasons, the proportion who have
completed middle school or higher is also greater among women who have
discontinued contraception than among the NFHS sample as a whole. Among women
who have discontinued contraception, 73% are Hindus, 20% are Muslims, and 7%
belong to other religions. This over-representation of Muslims, compared with the
proportion of Muslims in the overall NFHS sample (12%) reflects Muslim women’s
preference for temporary methods. Only 14% of women who have discontinued
contraception belong to scheduled castes or scheduled tribes, compared with 21% in
these groups in the total NFHS sample. This is primarily because contraceptive use
rates are much lower among women in scheduled castes or tribes than among other
women. Sixty-five percent of women who have discontinued contraception are
regularly exposed to electronic mass media, compared with 53% in the NFHS sample
as a whole. This reflects the comparatively high use of family planning and choice of
temporary methods among women exposed to the media.

17
National Family Health Survey Subject Reports, No. 13
Table 4 Variable definitions and mean values for currently married, non-pregnant, non-sterilized women
(whose husbands were also not sterilized) age 13–49 who had previously used contraception but were not
using contraception at the time of the survey, by residence, India: NFHS, 1992–93
Mean value of variable
expressed as percentage
Variable name Variable definition Total Urban Rural
Response variables
Reasons for discontinuation
Wanted child Reason for discontinuing contraception is 29 25 31
‘wanted to have a child’ or ‘wanted to
replace dead child’
Method problem or failure Reason for discontinuing contraception is 38 44 35
‘created health problem’, ‘created menstrual
problem’, ‘method failed/ got pregnant’, ‘did
not like the method’, ‘inconvenient to use’,
‘lack of sexual satisfaction’, ‘lack of privacy
for use’, ‘hard to get method’, ‘put on weight’
Other Other reason 33 32 34
Predictor variables
Age group
13–24 Woman is in the age group 13–24 years 29 22 33
25–34 Woman is in the age group 25–34 years 39 40 38
35–49 Woman is in the age group 35–49 years 32 38 29
Residence
Urban Woman lives in an urban area 35 100 0
Rural Woman lives in a rural area 65 0 100
Education
Illiterate Woman is illiterate 44 22 56
Literate, < middle complete Woman is literate with less than a 22 21 23
middle school education
≥ middle school complete Woman is literate with at least a 34 57 22
middle school education
Religion
a
Hindu Woman lives in a household whose head 73 74 72
is Hindu
Muslim Woman lives in a household whose head 20 20 20
is Muslim
Other religion Woman lives in a household whose head 7 6 8
is neither Hindu nor Muslim
Scheduled caste or scheduled
tribe
b
SC/ST Woman lives in a household whose head 14 6 17
belongs to a scheduled caste (SC) or a
scheduled tribe (ST)
Non-SC/ST Woman lives in a household whose head 86 94 83
does not belong to either a scheduled
caste (SC) or a scheduled tribe (ST)
Exposure to media
Exposed Woman is regularly exposed to electronic 65 87 54
mass media (radio or television at least
once a week or cinema at least once a month)
Not exposed Woman is not regularly exposed to radio, 35 13 46
televison, or cinema

18
National Family Health Survey Subject Reports, No. 13
Table 4, continued
Mean value of variable
expressed as percentage
Variable name Variable definition Total Urban Rural
Predictor variables
Region
North Woman lives in Delhi, Haryana, Himachal 12 13 11
Pradesh, Jammu region of Jammu and
Kashmir, Punjab, or Rajasthan
Central Woman lives in Madhya Pradesh or 24 22 25
Uttar Pradesh
East and Northeast Woman lives in Bihar, Orissa, West Bengal, 33 22 38
Arunachal Pradesh, Assam, Manipur, Meghalaya,
Mizoram, Nagaland, or Tripura
West Woman lives in Goa, Gujarat, or Maharashtra 11 18 8
South Woman lives in Andhra Pradesh, Karnataka, 21 25 18
Kerala, or Tamil Nadu
Number of women
c
Weighted number of currently married, 4,180 1,462 2,718
non-pregnant, non-sterilized women (includ-
ing women whose husbands are not sterilized)
age 13–49 who previously used contraception
but are not using contraception now
a. The ‘other religion’ category includes Christian, Sikh, Buddhist, Jain, and other religions.
b.
Scheduled castes (SC) and scheduled tribes (ST) are those castes and tribes identified by the Government of India as socially and econom-
ically disadvantaged and in need of protection from social injustice and exploitation.
c. Actual number of women varies slightly for individual variables depending on the number of missing values.
The distribution of women who have discontinued contraception varies consid-
erably across regions, largely reflecting the distribution of the total NFHS sample
across regions. The separate distributions for urban and rural areas indicate that cur-
rently married, non-pregnant, non-sterilized women who have discontinued contra-
ception tend to be younger, less educated, and less exposed to the media in rural
areas than in urban areas.
Table 5 shows unadjusted and adjusted effects of the predictor variables on
reasons for contraceptive discontinuation. Figure 3 depicts the adjusted effects of
age. The proportion reporting ‘method problem or failure’ as their main reason for
discontinuation is uniformly high (ranging from 27 to 48% in the adjusted estimates)
across all socioeconomic groups, suggesting wide-scale problems with the quality
of family planning services in India. No doubt a substantial proportion of these women
would have continued using family planning had they not faced a problem with the
method they were using.
As expected, the proportion reporting ‘wanted child’ as their main reason for
discontinuing contraception declines rapidly with age, from 48% among women age
13–24 to 11% among women age 35–49. Controlling for the socioeconomic vari-
ables in the table makes no difference in the estimated effect of age. The proportion
of women who report ‘method problem or failure’ as their main reason for contra-

19
National Family Health Survey Subject Reports, No. 13
Table 5 Unadjusted and adjusted effects of selected demographic and socioeconomic factors on reasons
for discontinuing contraception among currently married, non-pregnant, non-sterilized women (whose
husbands were also not sterilized) age 13–49 who had previously used contraception but were not using
contraception at the time of the survey, India: NFHS, 1992–93
Percentage giving specific reason
Unadjusted Adjusted
Method Method
Wanted problem Wanted problem
Variable child or failure
†
Other child or failure
†
Other
Age group
13–24
†
48 28 24 48 28 24
25–34 36* 39 26* 36* 38 26*
35–49 11* 40 49* 11* 39 50*
Residence
Urban 25* 44 32* 25* 44 31*
Rural
†
31 35 34 31 35 34
Education
Illiterate
†
29 39 33 30 40 30
Literate, < middle complete 26 37 37* 25 38 37*
≥ middle school complete 31 38 32 30 35 36*
Religion
Hindu
†
30 39 31 31 39 31
Muslim 25 34 40* 25 33 42*
Other religion 23 37 40* 22* 42 36
Scheduled caste or scheduled tribe
SC/ST 33* 34 32 31 34 35
Non-SC/ST
†
28 38 33 29 38 33
Exposure to media
Exposed 29 38 33 29 37 33
Not exposed
†
28 38 34 28 39 33
Region
North 32 29 39* 34* 27 39*
Central 26* 48 26* 25* 48 28*
East and Northeast 24 34 42* 24* 35 42*
West 38 43 19* 40 42 18*
South
†
31 35 34 32 35 33
Number of women 4,180 4,180
Note:
For definitions of variables see text and Table 4. Both unadjusted and adjusted percentages shown in this table are estimated by
multinomial logistic regression. Unadjusted percentages are based on separate multinomial logistic regressions for each predictor variable with
that variable as the only predictor variable. Adjusted percentages are based on a single multinomial logistic regression consisting of all the
predictor variables in the table. For any given predictor variable in the adjusted column, the set of control variables consists of all the other
predictor variables in the table.
†Reference category
*The coefficient in the underlying multinomial logistic regression differs significantly from 0 at the 5% level.
ceptive discontinuation increases with age. This may be in part because older women
have had more time than younger women to experience a method problem or failure.
It may also be that women who started using a method recently are less likely than
earlier users to have experienced a problem or failure because family planning meth-
ods have improved over time. Again, controlling for residence, education, and other
socioeconomic variables included in the table makes little difference in the esti-
mated effect of age. The proportion of women reporting ‘other’ reasons for discon-
20
National Family Health Survey Subject Reports, No. 13
Figure 3 Adjusted effects of age on reasons for discontinuing contraception, India:
NFHS, 1992–93
tinuation increases sharply with age, with about one-half of women in the 35–49 age
group reporting ‘other’ reasons.
Table 5 and Figure 4 show that the proportion reporting ‘wanted child’ is sig-
nificantly higher in rural areas than in urban areas, as expected. This effect of resi-
dence remains unchanged after controlling for other factors in the table. Urban women
are much more likely than rural women to report ‘method problem or failure’ as their
main reason for discontinuing contraception. This may be in part because of greater
health consciousness in urban areas. With few exceptions, education, caste/tribe,
media exposure, and region do not have significant effects on reasons for discontinu-
ation. Among religious categories, Hindus are most likely and women of ‘other religion’
are least likely to report ‘wanted child’ as their main reason for discontinuation.
Table 6 shows adjusted effects of the predictor variables on reasons for contra-
ceptive discontinuation separately for urban and rural areas. Age has the same effect
on reasons for discontinuation, whether urban and rural areas are considered sepa-
rately or together. The effects of education, however, are less consistent. In urban
areas, more-educated women are more likely than less-educated women to report
‘wanted child’ as a reason for discontinuation, and they are less likely to report ‘method
problem or failure’. In rural areas, education has no clear effect on reason for discon-
tinuation. The effects of most of the other predictor variables are not statistically
significant. Caste/tribe, media exposure, and region do not have any noteworthy ef-
fects on reasons for discontinuation, whether urban and rural areas are considered
together or separately.
48
36
11
28
38
39
0
10
20
30
40
50
13-24 25-34 35-49 13-24 25-34 35-49
A
g
e
g
roup
Adjusted percentage who wanted child/
had method problem
Wanted child Method problem
or failure
21
National Family Health Survey Subject Reports, No. 13
INTENTION NOT TO USE CONTRACEPTION IN THE FUTURE
There are several possible reasons why currently married women may not be using
contraception or may not intend to use contraception in the future. These include
lack of knowledge about contraception, lack of knowledge of a source where contra-
ceptives can be obtained, fear of contraception, difficulty in obtaining contracep-
tives, high cost of contraceptives, separation from husband, desire for more children,
opposition to family planning, health concerns or worries about side effects, or pre-
sumed infecundity (e.g., because of menopause). Women who are currently trying to
get pregnant may or may not intend to use contraception in the future. Women who
do not intend to use contraception in the future may believe that continued non-use
will be necessary to reach their desired family size. Nevertheless, desire for more
children is not, in general, a valid reason for not intending to use contraception at
any time in the future because contraception may be initiated after the desired num-
ber of children are born.
Reported reasons for not intending to use contraception
As mentioned, the NFHS did not collect information on women’s reasons for not
using contraception at the time of the interview. Currently married women who were
not using contraception were asked, however, whether they intended to use family
planning at any time in the future, and those who responded negatively were asked
Figure 4 Adjusted effects of urban/rural residence on reasons for discontinuing
contraception, India: NFHS, 1992–93
25
31
44
35
0
10
20
30
40
50
Urban Rural Urban Rural
Adjusted percentage who wanted child/
had method problem
Wanted child Method problem
or failure

22
National Family Health Survey Subject Reports, No. 13
Table 6 Adjusted effects of selected demographic and socioeconomic factors on reasons for discontinuing
contraception among currently married, non-pregnant, non-sterilized women (whose husbands were also
not sterilized) age 13–49 who had previously used contraception but were not using contraception at the
time of the survey, by residence, India: NFHS, 1992–93
Percentage giving specific reason
Urban Rural
Method Method
Wanted problem Wanted problem
Variable child or failure
†
Other child or failure
†
Other
Age group
13–24
†
46 34 20 49 26 26
25–34 37* 41 22 36* 36 28*
35–49 9* 42 50* 12* 38 50*
Education
Illiterate
†
20 53 27 34 34 32
Literate, < middle complete 23 43 34* 26* 36 38
≥ middle school complete 28* 40 33* 29 34 36
Religion
Hindu
†
27 44 30 32 36 31
Muslim 22 41 37* 28 28 44*
Other religion 15* 46 39 25 38 37
Scheduled caste or scheduled tribe
SC/ST 32 36 33 32 32 36
Non-SC/ST
†
24 44 32 31 35 34
Exposure to media
Exposed 25 44 31* 32 33 35
Not exposed
†
21 39 40 30 37 33
Region
North 25 27 48* 39 27 34
Central 19* 55 26* 28* 43 28*
East and Northeast 21 37 42* 26* 33 41
West 32 49 20* 46 36 17*
South
†
27 43 29 34 30 36
Number of women 1,462 2,718
Note
: For definitions of variables see text and Table 4. Adjusted percentages shown in this table are estimated by multinomial logistic regression.
Each set of adjusted percentages by residence is based on a single multinomial logistic regression consisting of all the predictor variables in the
table. For any given predictor variable, the set of control variables consists of all the other predictor variables in the table.
†Reference category
*The coefficient in the underlying multinomial logistic regression differs significantly from 0 at the 5% level.
their main reason. Nearly 60% of currently married women who were not using
contraception at the time of the survey did not intend to use contraception in the
future. Of these, 52% said that their main reason for not intending to use contracep-
tion was a desire for more children.
Table 7 and Figure 5 show the reasons women give for not intending to use
contraception. These are grouped into four broad categories—wants more children, can’t
have children, method problem, and opposition to family planning—plus a residual
‘other’ category. More
than half of all currently married, non-contracepting women
mention a desire for more children as their main reason for not intending to use
contraception in the future. This large proportion suggests that many women perceive
family planning as a means of stopping childbearing but not as a means of spacing

23
National Family Health Survey Subject Reports, No. 13
births. Another one-fifth report that they do not intend to use contraception because
they are infecund or because of health problems.
Fifteen percent of these women mention some method-related problem as their
main reason for not intending to use contraception. Only 0.4% mention cost, however,
suggesting that the Indian family planning programme has been successful in
providing inexpensive contraception or at least that women do not perceive cost as a
major impediment to contraceptive use. Only 1% report ‘inconvenient’ or ‘hard to
get methods’ as reasons for not intending to use contraception, suggesting that
availability and accessibility are also not perceived as major problems. India’s family
planning programme deserves credit for these achievements. Nevertheless, the fact
that about 14% of women who do not intend to use contraception in the future mention
method-related problems—including lack of knowledge, dislike of existing methods,
fear of sterilization, and worries about side effects—suggests that there is considerable
scope for improving the quality of family planning services.
Table 7 Reasons for not intending to use contraception among currently married women age 13–49 who
were not using contraception (and whose husbands were not using contraception) at the time of the
survey and who did not intend to use contraception in the future, by residence, India: NFHS, 1992–93
Percentage giving specific reason
Reason Total Urban Rural
Wants more children 52.1 45.7 53.8
Wants children 40.4 36.7 41.4
Wants a son 10.3 7.8 11.0
Wants a daughter 1.4 1.2 1.4
Can’t have children 20.4 26.9 18.6
Menopausal/had hysterectomy 11.6 13.9 11.0
Difficult to get pregnant 4.9 8.5 3.9
Health does not permit 3.9 4.5 3.7
Method problem 15.1 13.5 15.5
Lack of knowledge 4.3 2.1 4.8
Doesn’t like existing methods 3.2 3.7 3.1
Afraid of sterilization 2.7 2.2 2.8
Worry about side effects 1.8 2.2 1.7
Can’t work after sterilization 1.7 0.9 1.9
Inconvenient 0.7 1.7 0.5
Cost too much 0.4 0.4 0.5
Hard to get methods 0.3 0.3 0.2
Opposition to family planning 8.5 8.7 8.5
Against religion 3.5 3.8 3.5
Opposed to family planning 1.3 0.9 1.4
Husband opposed 3.3 3.4 3.2
Other people opposed 0.4 0.6 0.4
Other 3.9 5.2 3.5
Other 3.7 5.0 3.3
Don’t know 0.2 0.2 0.2
Total percent 100.0 100.0 100.0
Number of women 29,142 6,034 23,108
Note
: Percentages in this table differ slightly from those in Table 6.25 in the NFHS all-India report (IIPS 1995). The discrepancies occur because
in Table 6.25, 50 women with ‘don’t know’ responses were redistributed to other categories.

24
National Family Health Survey Subject Reports, No. 13
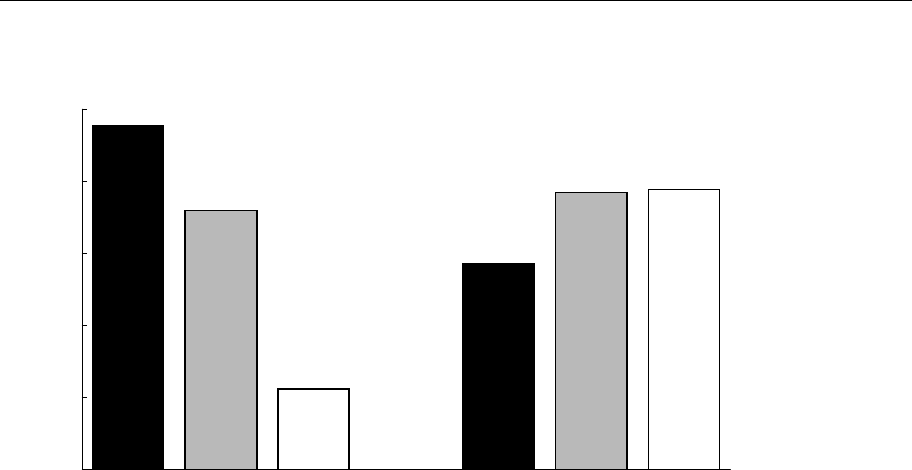
Figure 5 Major reasons for not intending to use contraception in the future, India:
NFHS, 1992–93
Nine percent of currently married, non-contracepting women report ‘opposition
to family planning’ as their main reason for not intending to use contraception in the
future. Further breakdown of this percentage reveals that 3.5% mention that family
planning is against their religion, 1.3% say that they themselves are opposed to family
planning, 3.3% say that their husbands are opposed, and 0.4% say that other people
are opposed. Government education and motivation campaigns might be advised to
focus on this group of women (and on their husbands) in an effort to persuade at least
some of them to change their attitudes about family planning.
Table 7 presents results separately for urban and rural areas. Rural women are
somewhat more likely than urban women to report ‘wants more children’ as their
main reason for not intending to use contraception in the future. They are also some-
what less likely to report ‘cannot have children’ as their main reason. Urban/rural
differences in the other two broad categories—method problems and opposition to
family planning—tend to be small. The one exception is ‘lack of knowledge’, men-
tioned by 4.8% of women in rural areas but only 2.1% in urban areas.
Table 8 and Figure 6 show variations at the state level. In Figure 6, states are
arranged in ascending order according to the proportion of women reporting ‘wants
more children’ as their main reason for not intending to use family planning. The
proportion reporting ‘wants more children’ tends to be higher and the proportion
reporting ‘can’t have children’ tends to be lower in states that have higher fertility
and lower levels of economic development. The proportion reporting ‘can’t have
children’ is also high in Punjab, for reasons that are unclear.
52
20
15
9
0
10
20
30
40
50
60
Wants more children Can't have children Method problem Opposition to famil
y
plannin
g
Percentage giving specific reason for
not intending to use

25
National Family Health Survey Subject Reports, No. 13
In Orissa, Arunachal Pradesh, Manipur, Nagaland, Goa, and Gujarat, 18% or
more of currently married, non-contracepting women who do not intend to use
contraception in the future report method problems as their main reason. By contrast,
9% or fewer of such women report method problems in Haryana, Himachal Pradesh,
Jammu, Punjab, and West Bengal. Interestingly, Kerala, which is the lowest-fertility
state, has one of the highest proportions (18%) of women reporting opposition to
family planning as their main reason for not intending to use contraception. This
may be due to a relatively high proportion of Muslims in the state. The proportion
citing opposition to family planning is also high—at 14% or more—in Meghalaya,
Nagaland, and Gujarat. Jammu, Punjab, Arunachal Pradesh, and Andhra Pradesh are
at the other extreme, with only 3% reporting opposition to family planning.
Table 8 Reasons for not intending to use contraception among currently married women age 13–49
who were not using contraception (and whose husbands were not using contraception) at the time
of the survey and who did not intend to use contraception in the future, by state: NFHS, 1992–93
Percentage giving specific reason
Wants Can’t Opposition
more have Method to family Number
State children children problem planning Other of women
India 52 20 15 9 4 29,142
North
Delhi 44 28 14 5 9 630
Haryana 46 36 6 8 4 429
Himachal Pradesh 50 30 8 5 6 468
Jammu region of Jammu and Kashmir 54 33 8 2 3 456
Punjab 39 44 9 2 6 431
Rajasthan 63 15 15 7 1 2,035
Central
Madhya Pradesh 66 12 14 4 5 2,017
Uttar Pradesh 53 15 16 11 5 5,467
East
Bihar 51 20 16 12 2 2,883
Orissa 53 20 19 5 4 1,554
West Bengal 40 33 9 11 7 782
Northeast
Arunachal Pradesh 66 6 24 3 1 382
Assam 49 23 15 6 7 714
Manipur 41 22 30 6 1 384
Meghalaya 56 15 14 14 1 457
Mizoram 67 18 10 6 0 145
Nagaland 45 17 19 19 1 422
Tripura 36 33 10 9 13 186
West
Goa 30 36 18 8 8 879
Gujarat 35 26 20 16 3 873
Maharashtra 52 25 13 8 2 1,139
South
Andhra Pradesh 59 23 15 3 1 1,292
Karnataka 50 22 16 8 3 1,222
Kerala 34 29 13 18 6 642
Tamil Nadu 44 27 16 5 8 1,171

26
National Family Health Survey Subject Reports, No. 13
Figure 6 Reasons for not intending to use contraception in the future (percentage
distribution by reason), by state: NFHS, 1992–93
0% 10% 20% 30% 40% 50% 60% 70% 80% 90% 100%
Mizoram
Madhya Pradesh
Arunachal Pradesh
Rajasthan
Andhra Pradesh
Me
g
halaya
Jammu re
g
ion
Uttar Pradesh
Orissa
Maharashtra
Bihar
Karnataka
Himachal Pradesh
Assam
Haryana
Na
g
aland
Delhi
Tamil Nadu
Manipur
West Ben
g
al
Punjab
Tripura
Gujarat
Kerala
Goa
Wants more children Can't have children Method problem Opposition to family plannin
g
Other

27
National Family Health Survey Subject Reports, No. 13
In states where a substantial proportion of women report method problems or
opposition to family planning as reasons for not intending to use contraception, im-
proving service quality and strengthening education and motivation campaigns could
make an important contribution to improving the performance of family planning
programmes.
Factors affecting reasons for not intending to use contraception
Table 9 gives definitions and mean values of the variables potentially affecting
women’s reasons for not intending to use contraception, both for India as a whole
and for urban and rural areas separately. The mean values refer to currently married
women age 13–49 who were not using contraception (and whose husbands were not
using contraception) and who did not intend to use contraception at any time in the
future. Mean values for the response variables have already been discussed in earlier
tables and figures. Because all predictor variables included in the analysis are cat-
egorical, the mean values for categories of a predictor variable are the same as the
proportions of women who fall in those categories.
3
Forty percent of women who do not intend to use contraception are in the
13–24 year age group, indicating that a substantial proportion of young Indian
women do not intend to use contraception. Four-fifths of the women are rural,
and three-quarters are illiterate. Eighty percent are Hindu, 16% are Muslim, and
4% belong to ‘other’ religions. About one-fourth are from scheduled castes or
tribes, and about three-fifths are not regularly exposed to the electronic mass
media.
Among women who do not intend to use contraception, the proportion in
the 13–24 age group is much higher in rural areas than in urban areas. The
proportion illiterate is also much higher in rural areas. The proportion who are
Muslim is much higher in urban areas, whereas the proportion who belong to a
scheduled caste or tribe is much higher in rural areas. The proportion who are
regularly exposed to the electronic mass media is much higher in urban areas.
Table 10 gives the unadjusted and adjusted effects of the seven demographic
and socioeconomic variables on reasons for not intending to use contraception.
Figure 7 depicts the adjusted effects of age.
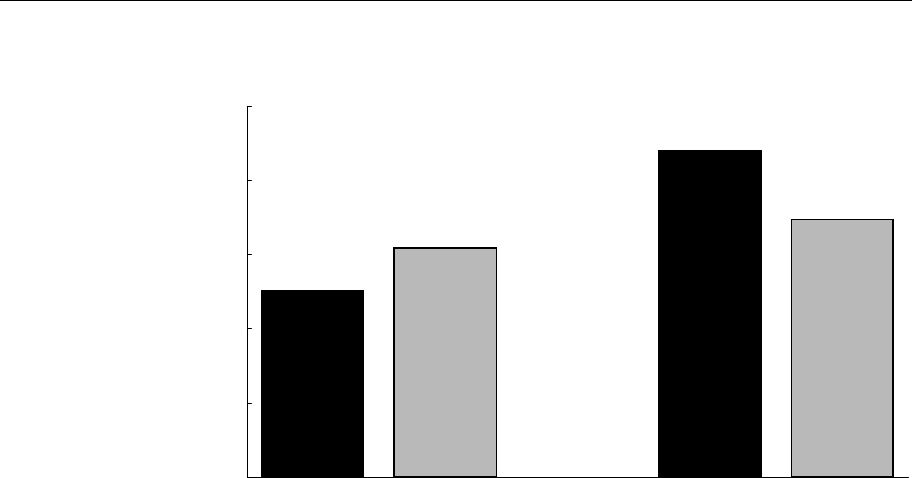
The proportion who report desire for more children as their main reason for
not intending to use contraception declines steeply with age, as expected. The
proportion who report that they cannot have children increases steeply with age,
also as expected. The proportion reporting a method problem as their main reason
3. The means of the predictor variables here are somewhat different from those given earlier
because in this table the small 'other' category is excluded.

28
National Family Health Survey Subject Reports, No. 13
Table 9 Variable definitions and mean values for currently married women age 13–49 who were not using
contraception (and whose husbands were not using contraception) at the time of the survey and who did
not intend to use contraception in the future, by residence, India: NFHS, 1992–93
Mean value of variable
expressed as percentage
Variable name Variable definition Total Urban Rural
Response variables
Reasons for not intending to use
contraception
Wants more children Reason for not intending to use contraception 54 48 56
in the future is ‘wants children’, ‘wants a son’,
or ‘wants a daughter’
Can’t have children Reason for not intending to use contraception 21 28 19
in the future is ‘menopausal/ had hysterectomy’,
‘difficult to get pregnant’, or ‘health does not
permit’
Method problem Reason for not intending to use contraception in 16 14 16
the future is ‘lack of knowledge’, ‘doesn’t like
existing methods’, ‘afraid of sterilization’, ‘worry
about side effects’, ‘can’t work after sterilization’,
'inconvenient', ‘cost too much’, or ‘hard to get
methods’
Opposition to family planning Reason for not intending to use contraception 9 9 9
in the future is ‘against religion’, ‘opposed
to family planning’, ‘husband opposed’, or
‘other people opposed’
Predictor variables
Age group
13–24 Woman is in the age group 13–24 years 40 32 42
25–34 Woman is in the age group 25–34 years 28 29 28
35–49 Woman is in the age group 35–49 years 32 39 30
Residence
Urban Woman lives in an urban area 20 100 0
Rural Woman lives in a rural area 80 0 100
Education
Illiterate Woman is illiterate 75 49 81
Literate, < middle complete Woman is literate with less than a 14 20 12
middle school education
≥ middle school complete Woman is literate with at least a 12 31 7
middle school education
Religion
a
Hindu Woman lives in a household whose head 80 69 83
is Hindu
Muslim Woman lives in a household whose head 16 24 13
is Muslim
Other religion Woman lives in a household whose head 4 6 4
is neither Hindu nor Muslim
Scheduled caste or scheduled
tribe
b
SC/ST Woman lives in a household whose head 23 13 26
belongs to a scheduled caste (SC) or a
scheduled tribe (ST)
Non-SC/ST Woman lives in a household whose head 77 87 74
does not belong to either a scheduled
caste (SC) or a scheduled tribe (ST)
Exposure to media
Exposed Woman is regularly exposed to electronic mass 42 73 34
media (radio or television at least once a week
or cinema at least once a month)
Not exposed Woman is not regularly exposed to radio, tele- 58 27 66
vision, or cinema

29
National Family Health Survey Subject Reports, No. 13
Table 9, continued
Mean value of variable
expressed as percentage
Variable name Variable definition Total Urban Rural
Predictor variables
Region
North Woman lives in Delhi, Haryana, Himachal 10 10 10
Pradesh, Jammu region of Jammu and
Kashmir, Punjab, or Rajasthan
Central Woman lives in Madhya Pradesh or Uttar 32 26 33
Pradesh
East and Northeast Woman lives in Bihar, Orissa, West Bengal, 27 18 30
Arunachal Pradesh, Assam, Manipur,
Meghalaya, Mizoram, Nagaland, or Tripura
West Woman lives in Goa, Gujarat, or Maharashtra 12 21 9
South Woman lives in Andhra Pradesh, Karnataka, 19 26 18
Kerala, or Tamil Nadu
Number of women
c
Weighted number of currently married women 28,022 5,718 22,304
age 13–49 who are not using any contraception
(and whose husbands are not using contraception)
and who do not intend to use contraception in the
future
a. The ‘other religion’ category includes Christian, Sikh, Buddhist, Jain, and other religions.
b.
Scheduled castes (SC) and scheduled tribes (ST) are those castes and tribes identified by the Government of India as socially and
economically disadvantaged and in need of protection from social injustice and exploitation.
c. Actual number of women varies slightly for individual variables depending on the number of missing values.
for not intending to use contraception is highest at ages 25–34. The proportion
reporting opposition to family planning is also much higher for women age 25–
34 than for the other two age groups. Controlling for socioeconomic variables does
not change these findings, which indicates that the effects of age on reasons for not
intending to use contraception are largely independent of the other variables considered
in this analysis. The relatively high proportions reporting method problems and
opposition to family planning in the 25–34 age group are worrisome because this age
group has the highest fertility levels.
Urban women are somewhat more likely than rural women to report ‘can’t
have children’ as a reason for not intending to use contraception in the future. A
woman’s education does not seem to have a large effect on her reasons for not
intending to use contraception, except that women who have completed middle school
or higher are somewhat less likely to report opposition to family planning than are
women with less education. Religion has a large effect, mainly because of opposition
to family planning among Muslims. As shown in Figure 8, Muslims are four to five
times more likely than Hindus or women of other religions to report opposition to
family planning as their main reason for not intending to use contraception. Controlling
for other demographic and socioeconomic factors has virtually no influence on this
effect, indicating that religion has an independent influence on women’s intention
not to use contraception.

30
National Family Health Survey Subject Reports, No. 13
Table 10 Unadjusted and adjusted effects of selected demographic and socioeconomic factors on
reasons for not intending to use contraception among currently married women age 13–49 who were not
using any contraception (and whose husbands were not using contraception) at the time of the survey
and who did not intend to use contraception in the future, India, NFHS, 1992–93
Percentage giving specified reason
Unadjusted Adjusted
Wants Can’t Opposition Wants Can’t Opposition
more have Method to family more have Method to family
Variable children
†
children problem planning children
†
children problem planning
Age group
13–24
†
86 3 7 4 87 3 7 4
25–34 55 19* 16* 9* 55 19* 16* 9*
35–49 8 76* 11* 5* 7 76* 11* 5*
Residence
Urban 48 29* 14 9* 52 24* 16 7*
Rural
†
56 20 16 9 55 20 16 9
Education
Illiterate
†
53 21 17 9 54 21 17 9
Literate, < middle complete 54 24* 12* 10 53 23* 14* 10*
≥ middle school complete 62 22* 12* 5* 59 21 14* 7*
Religion
Hindu
†
56 21 16 7 56 21 16 7
Muslim 39 17* 11 33* 39 16 11 33*
Other religion 48 30* 14 8* 54 23 15 8
Scheduled caste or scheduled
tribe
SC/ST 58 19* 17 6* 54 20 16 9
Non-SC/ST
†
53 22 15 10 54 21 16 9
Exposure to media
Exposed 57 23 13* 7* 59 20* 13* 8*
Not exposed
†
52 20 18 10 51 22 18 10
Region
North 58 23* 13* 6 59 22* 12* 7
Central 59 15* 16* 9* 62 14* 15* 9
East and Northeast 50 23 16 11* 52 24 15* 9*
West 48 26 15 10* 37 34* 18* 11*
South
†
52 26 16 6 51 24 18 7
Number of women 28,022 28,019
Note
: For definitions of variables see text and Table 9. Both unadjusted and adjusted percentages shown in this table are estimated by
multinomial logistic regression. Unadjusted percentages are based on separate multinomial logistic regressions for each predictor variable, with
that variable as the only predictor variable. Adjusted percentages are based on a single multinomial logistic regression consisting of all the
predictor variables in the table. For any given predictor variable in the adjusted column, the set of control variables consists of all the other
predictor variables in the table.
† Reference category
* The coefficient in the underlying multinomial logistic regression differs significantly from 0 at the 5 percent level.
Membership in a scheduled caste or tribe does not have a noticeable effect on
reasons for not intending to use family planning. Exposure to electronic mass media
does have an effect, however. Women who are regularly exposed to the electronic
mass media are less likely than other women to report method-related problems or
opposition to family planning as their main reason for not intending to use
contraception. Controlling for other factors reduces this effect very little, as shown
in Figure 9. There are some regional variations in the proportions of women reporting
various reasons for not intending to use contraception.

31
National Family Health Survey Subject Reports, No. 13
Figure 7 Adjusted effects of age on method problem and opposition to family
planning as main reasons for not intending to use contraception in the future, India:
NFHS, 1992–93
Figure 8 Unadjusted and adjusted effects of religion on opposition to family
planning as main reason for not intending to use contraception in the future,
India: NFHS, 1992–93
7
16
11
4
9
5
0
3
6
9
12
15
18
13-24 25-34 35-49 13-24 25-34 35-49
Percentage who reported method problem/
opposition to family planning
Method problem Opposition to
famil
y
plannin
g
7
33
8
7
33
8
0
5
10
15
20
25
30
35
Hindu Muslim Other Hindu Muslim Other
Percentage who reported opposition to
family planning
Unad
j
usted Ad
j
usted

32
National Family Health Survey Subject Reports, No. 13
Table 11 shows the adjusted effects of the predictor variables on reasons for not
intending to use contraception separately for urban and rural areas. The adjusted
effects when urban and rural areas are considered separately are quite similar to the
effects when they are considered together, except that religion has a somewhat stronger
effect on opposition to family planning in rural areas than in urban areas.
CONCLUSIONS AND POLICY RECOMMENDATIONS
Programme managers and policymakers responsible for developing and implementing
effective family planning services need to understand why some couples stop using
contraception or do not intend to use contraception in the future. Because sterilization
is the most widely used contraceptive method in India, there has been limited scope
for contraceptive discontinuation. This situation is now changing, however, as more
Indian couples choose temporary methods and as the government places greater
emphasis on spacing methods as part of its family planning, reproductive health, and
child survival programmes.
Results from this analysis indicate that women do not perceive availability,
accessibility, or cost as major impediments to using contraception. Only 1% of
currently married, non-pregnant women who have discontinued contraceptive use
report ‘hard to get method’ as their main reason for discontinuation. Only 0.4% report
‘cost too much’, and only 1% report ‘inconvenient’ or ‘hard to get methods’ as their
main reasons for not intending to use contraception in the future.
Figure 9 Unadjusted and adjusted effects of exposure to electronic mass media on
method problems and opposition to family planning as main reasons for not
intending to use contraception in the future, India: NFHS, 1992–93
13
18
13
18
7
10
8
10
0
5
10
15
20
Exposed Not
exposed
Exposed Not
exposed
Exposed Not
exposed
Exposed Not
exposed
Percentage who reported method problem/
opposition to family planning
Method problem Opposition to famil
y
plannin
g
Unad
j
usted Ad
j
usted Unad
j
usted Ad
j
usted

33
National Family Health Survey Subject Reports, No. 13
Table 11 Adjusted effects of selected demographic and socioeconomic factors on reasons for not intending to
use contraception among currently married women age 13–49 who were not using contraception (and whose
husbands were not using contraception) at the time of the survey and who did not intend to use contraception
in the future, by residence, India: NFHS, 1992–93
Percentage giving specified reason
Urban Rural
Wants Can’t Opposition Wants Can’t Opposition
more have Method to family more have Method to family
Variable children
†
children problem planning children
†
children problem planning
Age group
13–24
†
88 3 5 4 86 3 7 4
25–34 55 21* 14* 10* 55 19* 17* 9*
35–49 9 76* 10* 5* 7 76* 11* 5*
Education
Illiterate
†
47 28 15 10 55 19 17 9
Literate, < middle complete 43 32 13 12* 56 21 14* 9
≥ middle school complete 54 26* 14* 7* 59 20 13* 7*
Religion
Hindu
†
50 29 15 6 57 19 17 7
Muslim 41 23 12 25* 38 15* 11 36*
Other religion 45 32 17 6 56 21 14 9
Scheduled caste or scheduled
tribe
SC/ST 48 29 13 10 56 19 17 9
Non-SC/ST
†
48 28 14 9 56 20 16 9
Exposure to media
Exposed 50 29 13* 9* 61 18* 13* 8*
Not exposed
†
44 27 19 11 53 20 18 9
Region
North 50 35 10* 5 61 18* 12* 8
Central 59 16* 15 10 62 13* 15* 9
East and Northeast 45 29 15 11* 54 22 16* 9
West 34 42* 13* 11* 38 31* 19* 12*
South
†
49 29 14 8 51 23 19 7
Number of women 5,716 22,304
Note
: For definitions of variables see text and Table 9. Adjusted percentages shown in this table are estimated by multinomial logistic regression.
Each set of adjusted percentages by residence is based on a single multinomial logistic regression consisting of all the predictor variables in the
table. For any given predictor variable, the set of control variables consists of all the other predictor variables in the table.
† Reference category
* The coefficient of the underlying multinomial logistic regression differs significantly from 0 at the 5% level.
Replacing a dead child does not play a significant role in contraceptive
discontinuation in India, at least not at the aggregate level. Only 0.5% of women who
have discontinued contraception report this as their main reason.
A large proportion of women (38%) report method problems and method failure
as major reasons for discontinuing contraception. This proportion is considerably
higher in urban areas (44%) than in rural areas (35%), perhaps because urban women
may be more aware of method-related problems than rural women. If this is the case,
a larger proportion of rural women may be experiencing method-related problems
than indicated here. The proportion of women reporting method problems or failure
is uniformly high across all socioeconomic categories, both within each state and in
the nation as a whole.

34
National Family Health Survey Subject Reports, No. 13
There are, however, large variations among states. In Uttar Pradesh and Madhya
Pradesh—large states with high fertility—about one-half of all women who have
discontinued contraception reported a method problem or failure as their main reason.
This proportion is even higher in Orissa and in some northeastern states. No doubt
many of these women would have continued using contraception had they not faced
such problems. These findings indicate a need to improve the quality of family planning
services in many states.
In India as a whole, about one-fourth of women who do not intend to use
contraception in the future report method problems or opposition to family planning
as their main reason. This proportion varies widely among states. Women age 25–34
are much more likely than women in other age groups to report a method problem or
opposition to family planning as their main reason for not intending to use
contraception. The strong effect of age is independent of any of the socioeconomic
variables included in the analysis.
Women who are regularly exposed to the electronic mass media are less likely
than other women to report method problems or opposition to family planning as
their main reason for not intending to use contraception in the future. Muslim women
are four to five times more likely than Hindu women or women of other religions to
report opposition to family planning as their main reason for not intending to use
contraception. As with age, the strong effect of religion is independent of any of
the other socioeconomic variables.
India’s family planning programme needs to pay special attention to those states
where the proportion of women reporting method problems or opposition to family
planning is relatively high. The programme also needs to focus on women age 25–34
and on Muslim women. With better information and motivation campaigns and
improvements in the quality of family planning services, it may be possible to persuade
a large proportion of these women to adopt contraception.
The NFHS did not collect data on reasons why women were not using
contraception at the time of the survey. Neither did the survey collect adequate data
on the quality of family planning services, which is often the root cause of women’s
problems with methods and opposition to family planning. The second National Family
Health Survey (NFHS-2), which is currently in progress, will address some of these
information gaps. The new survey asks currently married, non-pregnant women who
are not using contraception why they are not using family planning. Also, the NFHS-
2 is collecting more accurate information on the main reason women give for not
intending to use contraception in the future. Finally, the new survey has added a
number of questions that measure the quality of family planning services. This new
information, when it becomes available, will shed more light on why women
discontinue contraception, why they are not current contraceptive users, and why
they do not intend to use contraception in the future.

35
National Family Health Survey Subject Reports, No. 13
ACKNOWLEDGMENTS
We thank Fred Arnold for valuable comments on an earlier draft of this paper, Victoria
Ho and Noreen Tanouye for computer and research assistance, Sidney B. Westley
and Loraine Ikeda for editorial assistance, and O. P. Sharma for assistance with printing
and distribution.
REFERENCES
Ahmed, G., E. C. Liner, N. E. Williamson, and W. P. Schellstede. 1990. Characteristics of
condom use and associated problems: Experience in Bangladesh. Contraception
42(5): 523–33.
Choe, M. K., N. Y. Luther, A. Pandey, D. Sahu, and J. Chand. 1999. Identifying children with
high mortality risk. National Family Health Survey Bulletin No. 12. Mumbai:
International Institute for Population Sciences; and Honolulu: East-West Center.
Esseghairi, K., P. R. A. Hinde, J. W. McDonald, and S. Meddeb. 1991. IUD and pill use
dynamics in Tunisia and Morocco. In Demographic and Health Surveys World
Conference: Proceedings, vol. 3, pp. 119–34. Washington, D.C.: Macro
International, Inc.
Fakeye, O., and O. Babaniyi. 1989. Reasons for non-use of family planning methods at Ilorin,
Nigeria: Male opposition and fear of methods. Tropical Doctor 19(3): 114–7.
Fakhr El-Islam, M., T. H. Malasi, and S. I. Abu-Dagga. 1988. Oral contraceptives, sociocultural
beliefs and psychiatric symptoms. Social Science and Medicine 27(9): 941–5.
Gandotra, M. M., and N. P. Das. 1990. Contraceptive choice, shift and use continuation: A
prospective study in Gujarat. Journal of Family Welfare 36(3): 54–69.
IIPS (International Institute for Population Sciences). 1995. National Family Health
Survey (MCH and Family Planning): India, 1992–93. Bombay: International
Institute for Population Sciences.
Jejeebhoy, S. 1989. Measuring the quality and duration of contraceptive use: An overview of
new approaches. Population Bulletin of the United Nations 26:1–36.
Levine, R. E., H. E. Cross, S. Chhabra, and H. Viswanathan. 1992. Quality of health and
family planning services in rural Uttar Pradesh: The client’s view. Demography
India: 21(2) 247–65.
Ministry of Health and Family Welfare. 1998a. Manual on community needs assessment
approach in Family Welfare Programme. New Delhi: Department of Family
Welfare, Ministry of Health and Family Welfare.
Ministry of Health and Family Welfare. 1998b. Annual Report: 1997–98. New Delhi:
Ministry of Health and Family Welfare.
Mishra, V. K. 1999. Why do Muslims have more children in India? Paper presented at the
Population Association of America Annual Meeting, 25–27 March, New York.

36
National Family Health Survey Subject Reports, No. 13
Narayana, G. 1998. Targets for family planning in India: An analysis of policy change,
consequences, and alternative choices. New Delhi: The Policy Project, Futures
Group International.
Nair, P. S., G. Feeney, V. K. Mishra, and R. D. Retherford. 1999. Factors affecting source
of family planning services in India. National Family Health Survey Subject
Reports, No. 12. Mumbai: International Institute for Population Sciences; and
Honolulu: East-West Center.
Population Reference Bureau. 1998. Family planning saves lives. Washington, D.C.:
Population Reference Bureau.
Population Research Centre, Dharwad. 1991. Bottlenecks in the promotion of IUD usage
among rural women: Insights from evaluation studies conducted in northern
Karnataka. Journal of Institute of Economic Research 26(1&2): 17–28.
Population Research Center, Thiruvananthapuram. 1995. National Family Health Survey
(MCH and Family Planning), Kerala 1992–93. Thiruvananthapuram: Population
Research Center, University of Kerala; and Bombay: International Institute for
Population Sciences.
Prabhavathi, K., and A. Sheshadri. 1988. Pattern of IUD use: A follow-up of acceptors in
Mysore. Journal of Family Welfare 35(1): 3–16.
Ramesh, B. M., S. C. Gulati, and R. D. Retherford. 1996. Contraceptive use in India,
1992–93. National Family Health Survey Subject Reports, No. 2. Mumbai:
International Institute for Population Sciences; and Honolulu: East-West Center.
Rajaretnam, T., and R. V. Deshpande. 1994. Factors inhibiting the use of reversible
contraceptive methods in rural south India. Studies in Family Planning 25(2):
111–21.
Retherford, R. D., and M. K. Choe. 1993. Statistical models for causal analysis. New
York: John Wiley and Sons, Inc.
Retherford, R. D., and V. Mishra. 1997. Media exposure increases contraceptive use.
National Family Health Survey Bulletin, No. 7. Mumbai: International Institute
for Population Sciences; and Honolulu: East-West Center.
Simmons, G. B., R. S. Simmons, B. D. Mishra, and A. Ashraf. 1971. Organization for
change: A systems analysis of family planning in rural India. Ann Arbor,
Michigan: Center for Population Planning, University of Michigan School of
Public Health.
Sturley, A. E. 1998. Perceptions of contraception in rural Nepal. Unpublished Ph.D.
dissertation. Honolulu: School of Public Health, University of Hawaii.
Talwar, P. P., K. L. Gaba, and H. B. Chanana. 1986. Factors affecting acceptance and non-
acceptance of family planning: A study in low income population in Delhi. New
Delhi: National Institute of Health and Family Welfare.
Winikoff, B., and M. Sullivan. 1987. The role of family planning in reducing maternal
mortality. Studies in Family Planning 18(3): 128–43.
