
Demographic Prole of Adult
Limited English Speakers in
Massachusetts
The BPDA Research Division presents a prole on adults in Massachusetts with limited En-
glish-speaking abilities. Limited English-Speaking (LES) adults are self-reported as speak-
ing English less than "very well". The prole includes where LES adults live in Massachu-
setts, population demographics and workforce statistics.

The Boston Planning & Development Agency
We strive to understand the current environment of the city to produce quality research and targeted
information that will inform and benet the residents and businesses of Boston. Our Division conducts
research on Boston’s economy, population, and commercial markets for all departments of the BPDA, the City
of Boston, and related organizations.
The information provided in this report is the best available at the time of its publication. All or partial
use of this report must be cited.
Author: Boston Planning & Development Agency, Research Division.
Date: February 2019.
Information: Pease visit bostonplans.org/research-publications for more information.
Requests: Please contact us at bostonplans.org/research-inquiries with additional questions.
Follow us on Twitter
twitter.com/BostonPlans
Visit our website
BostonPlans.org
Research Division
Director
Alvaro Lima
Deputy Director
Jonathan Lee
Senior Research
Associate
Christina Kim
Senior
Economist
Matthew Resseger
Senior Demographer
Phillip Granberry
Research Associate
Kevin Kang
Research Manager
Kelly McGee
Research Assistants
Jing Chen
Avanti Krovi
Kayla Myros
Interns
Erin Cameron
Ahsim Shaaban
Dilara Sisman
Brian P. Golden, Director

BostonPlans.org | 3
Population of Adult Limited English Speakers in Massachusetts
Source: U.S. Census Bureau, 2012-2016 American Community Survey, PUMS, BPDA Research Division Analysis.
Approximately 528,324 Massachusetts residents ages 18 and over speak limited English, self-reporting that
they speak English less than “very well”.
1
This equates to just under 10 percent of the adult population lacking
prociency in English. Of the limited-English speaking (LES) adults in Massachusetts, approximately 84,000 do
not speak English at all, 18,500 speak some English but do not speak it “well”, and 258,000 self-report that they
speak English well, but not “very well”. Figure 1 provides the breakdown of Massachusetts adults by English
speaking ability.
The largest LES populations are found in the major urban centers of the Commonwealth—including Boston,
Lawrence, Worcester, Lowell, and Springeld. Boston alone is home to 100,000 limited-English speaking adults
– 11 percent of all adults in Boston. A high share of the adult population in some Massachusetts cities and towns
are limited English speakers. The cities and towns with the highest shares of adults speaking limited English are
Chelsea (33 percent), Lawrence (31 percent), Lynn (16 percent) and Everett (16 percent).
84,026
185,713
258,334
0
50,000
100,000
150,000
200,000
250,000
300,000
Not at all Not well Well
Masschusetts Adult Residents
Ability to Speak English
1
The U.S. Census Bureau collects information regarding a person’s ability to speak English. Respondents who report
that they speak a language other than English at home are asked if they speak English “very well,” “well,” “not well,” or “not
at all”. For the context of this report, respondents are considered “limited-English speakers” if they respond “not at all,”
“not well,” or “well”. Respondents who speak English only or speak English “very well” in addition to another language are
considered procient in English.
FIGURE 1
Massachusetts Residents by English Speaking Ability
2016

Demographic Profile of Adult Limited English Speakers in Massachusetts
Almost 150,000 households in Massachusetts – 5.6 percent of all households - do not have anyone age 14
or older who is procient in English. 40.1 percent of these households speak Spanish. Approximately 54,000
school age children (age 5 to 17) live in limited English speaking households. About 11 percent of these children
themselves speak English only, but there is no adult in their household who speaks English very well. More than
47 percent of the school age children in limited English speaking households speak Spanish. Map 1 below shows
where the Limited English-Speaking adults live in Massachusetts by county subdivision.
2
2
County sub-divisions are divisions of counties used by the U.S. Census Bureau. In many cases they conform to city/town
boundaries.
Limited English Speaking Households
MAP 1
Number of Limited English Speaking (LES) Adults in Massachusetts by
County Subdivison
2016
14,046
14,331
15,746
16,962
17,987
18,982
19,866
25,149
25,165
100,147
- 30,000 60,000 90,000 120,000
Malden
New Bedford
Brockton
Quincy
Lynn
Springfield
Lowell
Lawrence
Worcester
Boston
County Subdivisions with the Highest
Number of LES Adults

BostonPlans.org | 5
Number of Children, ages 5 to 17, in Limited English-Speaking
Households in Massachusetts by County Subdivision
2016
MAP 2
Map 2 shows the number of children aged ve to 17 years that live in Limited English-Speaking households in
each county-subdivision in Massachusetts.
Number of Limited English Speaking (LES) Adults in Massachusetts by
County Subdivison
2016
1,615
1,737
1,810
2,041
2,103
2,653
2,732
2,884
4,044
10,196
0 3,000 6,000 9,000 12,000
Quincy
Chelsea
Brockton
New Bedford
Lowell
Lynn
Springfield
Lawrence
Worcester
Boston
County Subdivision with Highest Number of
Children in LES Households

Demographic Profile of Adult Limited English Speakers in Massachusetts
Source: U.S. Census Bureau, 2012-2016 American Community Survey, Public Use Microdata Sample (PUMS), BPDA Research
Division Analysis.
FIGURE 3
Massachusetts Adults by Race/Ethnicity and English Prociency
2016
Source: U.S. Census Bureau, 2012-2016 American Community Survey, Public Use Microdata Sample (PUMS), BPDA Research
Division Analysis.
FIGURE 2
Massachusetts Adults by Age and English Prociency
2016
Limited English speaking adults in Massachusetts tend to be older – 76 percent are age 35 and older, com-
pared to 69 percent of the English procient population. Figure 2 provides the age distribution of adult
limited English speakers compared to those who speak English prociently.
The majority of limited English speaking adults in Massachusetts are Hispanic or Asian – 38 percent are
Hispanic and 24 percent are Asian. In contrast, 82% of Massachusetts adults who are procient in English
are non-Hispanic Whites. Figure 3 shows the share of each racial/ethnic group that are limited English
speaking.
7%
17%
20%
36%
20%
14%
17%
15%
35%
19%
0%
5%
10%
15%
20%
25%
30%
35%
40%
18 to 24 25 to 34 35 to 44 45 to 64 65+
Limited English Speaking English Proficient
24%
10%
38%
24%
4%
82%
6% 6%
4%
2%
0%
10%
20%
30%
40%
50%
60%
70%
80%
90%
White Black/African
American
Hispanic/Latino Asian/Pacific
Islander
Other
Limited English Speaking English Proficient

BostonPlans.org | 7
Massachusetts Adults by Race/Ethnicity and English Prociency
2016
Top Places of Birth of Adult LES Massachusetts Residents
2016
LES adult residents of Massachusetts were born in 147 dierent countries and territories. The top 20 plac-
es of birth are given in Table 1. Of the 31,406 limited English speaking adults who were born in the United
States, 65.7 percent were born in Massachusetts.
TABLE 1
Source: U.S. Census Bureau, 2012-2016 American Community Survey, Public Use Microdata Sample (PUMS), BPDA Research
Division Analysis.
Overall 16.2 percent of Massachusetts LES adults are native-born U.S. citizens, 37.9 percent are naturalized
citizens, and 45.9 percent of LES adults (242,699) are not U.S. citizens. Non-citizens could include green card
holders, international students, H-1B workers, refugees, or unauthorized immigrants, among others.
Place of Birth LES Massachusetts
Adults
Percent of LES
Massachusetts Adults
Dominican Republic 50,687 9.6%
Puerto Rico 50,367 9.5%
China 47,488 9.0%
Brazil 33,374 6.3%
USA (excluding territories) 31,406 5.9%
El Salvador 28,200 5.3%
Haiti 27,922 5.3%
Vietnam 24,657 4.7%
Portugal 20,647 3.9%
Guatemala 19,213 3.6%
Cabo Verde 15,216 2.9%
India 13,619 2.6%
Colombia 11,431 2.2%
Cambodia 9,496 1.8%
Mexico 7,166 1.4%
Russia 6,830 1.3%
Azores Islands 6,740 1.3%
Honduras 6,484 1.2%
Italy 6,480 1.2%
Korea 5,709 1.1%

Demographic Profile of Adult Limited English Speakers in Massachusetts
The most commonly spoken language at home for LES residents of Massachusetts is Spanish, which accounts
for 38.9 percent of adult LES residents. This is more than three times the frequency of LES adults speaking
Portuguese at home (the second most common language) and ve times the frequency of LES adults speaking
Chinese (the third most common language). The 20 most common languages are presented in Table 2.
Source: U.S. Census Bureau, 2012- 2016 American Community Survey, Public Use Microdata Sample (PUMS), BPDA Research
Division Analysis.
TABLE 2
Language Spoken at Home of Adult LES Massachusetts Resident
2016
Language Spoken at Home LES Massachusetts
Adults
Percent of LES
Massachusetts Adults
Spanish 205,573 38.9%
Portuguese 65,695 12.4%
Chinese 37,482 7.1%
Haitian 30,891 5.8%
Vietnamese 23,360 4.4%
Russian 15,640 3.0%
Arabic 13,156 2.5%
Cantonese 11,032 2.1%
Khmer (Cambodian) 10,091 1.9%
French 9,499 1.8%
Kabuverdianu (Cape Verdean) 8,825 1.7%
Mandarin 8,651 1.6%
Italian 8,550 1.6%
Greek 6,208 1.2%
Korean 6,066 1.1%
Polish 5,587 1.1%
Albanian 4,605 0.9%
Hindi 3,889 0.7%
Gujarati 3,804 0.7%
Japanese 3,220 0.6%

BostonPlans.org | 9
Language Spoken at Home of Adult LES Massachusetts Resident
2016
Massachusetts Adults by Educational Attainment and English Prociency
2016
Source: U.S. Census Bureau, 2012-2016 American Community Survey, Public Use Microdata Sample (PUMS), BPDA Research
Division Analysis.
FIGURE 4
Limited English speaking adults tend to have lower levels of education than adults who are procient
in English. Almost 37 percent of Limited-English Speaking adults have less than a high school educa-
tion, and less than 18 percent have a Bachelor’s degree or higher. Figure 4 provides a visualization of
the relationship between English prociency and education.
37%
30%
15%
18%
7%
25%
28%
40%
0%
5%
10%
15%
20%
25%
30%
35%
40%
45%
Less than high school High school or
equivalence
Some college Bachelor's or higher
Limited English Speaking English Proficient
Demographic Profile of Adult Limited English Speakers in Massachusetts
Massachusetts Adults by Employment Status and English Ability
2016
Source: U.S. Census Bureau, 2012-2016 American Community Survey, Public Use Microdata Sample (PUMS), BPDA Research
Division Analysis.
Note: The unemployment rates given by the 5-year ACS will dier from the monthly rates given by the Bureau of Labor Statistics.
FIGURE 5
Limited English Speakers living in Massachusetts are less likely to participate in the labor force – 40 percent
of LES adults are not in the labor force compared to 31 percent of procient English speaking adults. Figure 5
shows the employment status and English prociency of adults in Massachusetts.
Limited English Speaking Massachusetts Residents in the Workforce
55%
5%
40%
65%
4%
31%
0%
10%
20%
30%
40%
50%
60%
70%
Employed Unemployed Not in Labor Force
Limited English Speaking English Proficient

BostonPlans.org | 11
Massachusetts Adults by Class of Workers and English Prociency
2016
Source: U.S. Census Bureau, 2012-2016 American Community Survey, BPDA Research Division Analysis.
FIGURE 6
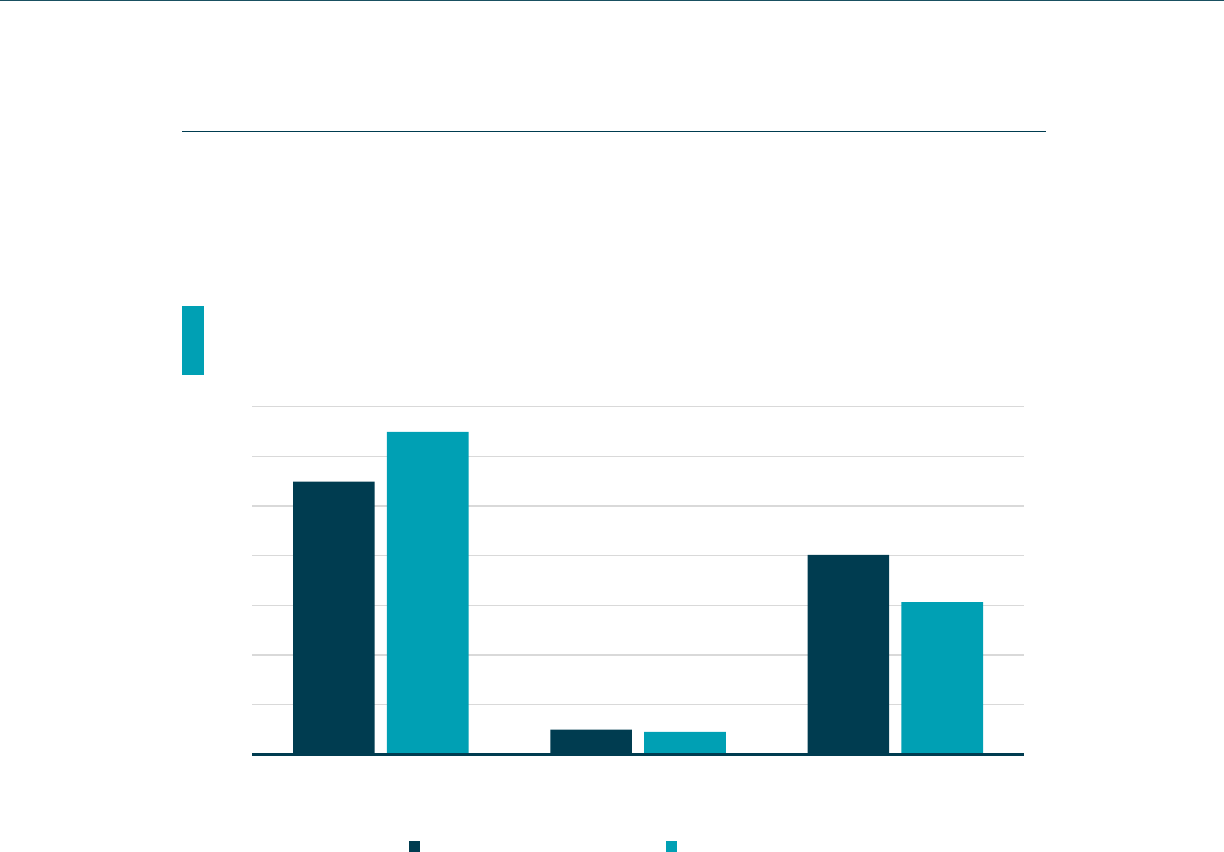
Limited English Speakers are less likely to hold government jobs than English procient adults. About 5 percent
of LES adults work in government while 12.9 percent of English-procient adults hold government jobs. LES
adults who are self-employed compose 9.7 percent of the population, similar to the 8.8 percent of self-em-
ployed, English procient adults. Figure 6 breaks down Massachusetts resident workers by type of employ-
ment.
Massachusetts Adults by Employment Status and English Ability
2016
83%
5%
10%
2%
77%
13%
9%
1%
0%
10%
20%
30%
40%
50%
60%
70%
80%
90%
Private Employee Government Workers Self-Employed Working without pay
Limited English Speaking English Proficient
Demographic Profile of Adult Limited English Speakers in Massachusetts
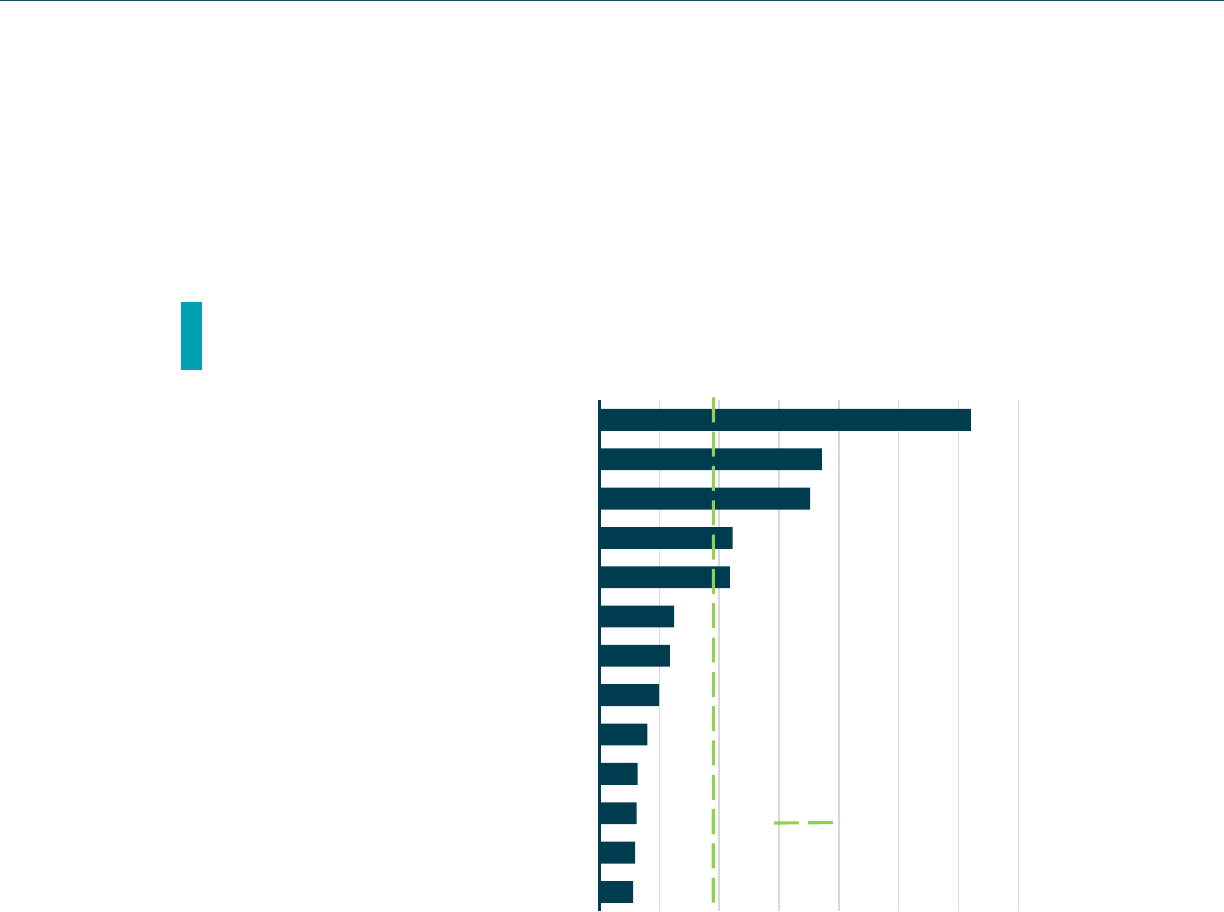
Share of Massachusetts Residents Working in Occupations who are LES
2016
FIGURE 7
There are signicant dierences in the occupations of limited-English speaking residents and procient-English
speaking residents. LES working adults in Massachusetts make up 9.9 percent of working residents. However,
they make up 31 percent of workers in building and grounds cleaning and maintenance, 19 percent of workers
in production, transportation, and material moving and 18 percent of workers in food preparation and serving.
LES workers are also overrepresented in healthcare support, personal care, natural resources, construction,
and maintenance.
3
In contrast, limited English speakers make up only four percent of healthcare practitioners,
and three percent each of workers in education, management, business, and legal, community, and social ser-
vices. The relative representation of limited English speakers in dierent occupations is shown in Figure 7.
3
Agriculture, Forestry, Fishing & Hunting and Mining, Quarrying, and Oil & Gas Extraction
Source: U.S. Census Bureau, 2012-2016 American Community Survey, BPDA Research Division Analysis.
Approximately 22 percent of Limited English-Speaking Massachusetts resident workers work in Suolk County
and about half work in Essex, Middlesex, Worcester, Norfolk, Bristol, or Plymouth counties. About 78,000 LES
Massachusetts residents (22 percent) work out of state.
2.8%
3.0%
3.1%
3.2%
4.0%
5.0%
5.9%
6.2%
10.9%
11.1%
17.6%
18.6%
31.0%
0% 5% 10% 15% 20% 25% 30% 35%
Legal, Community & Social Service, Arts, Design, Entertainment,
Sports, & Media
Business & Financial
Management
Education, Training, & Library
Healthcare Practitioners & Technical
Office & Administrative Support
Sales Related
Computer, Engineering, & Science
Healthcare Support, Personal Care & Service, & Protective Service
Natural Resources, Construction, & Maintenance
Food Preparation & Serving
Production & Transportation & Material Moving
Building & Grounds, Cleaning & Maintenance
9.9% of Massachusetts resident
workers are Limited English Speakers
BostonPlans.org | 13
Share of Massachusetts Residents Working in Occupations who are LES
2016
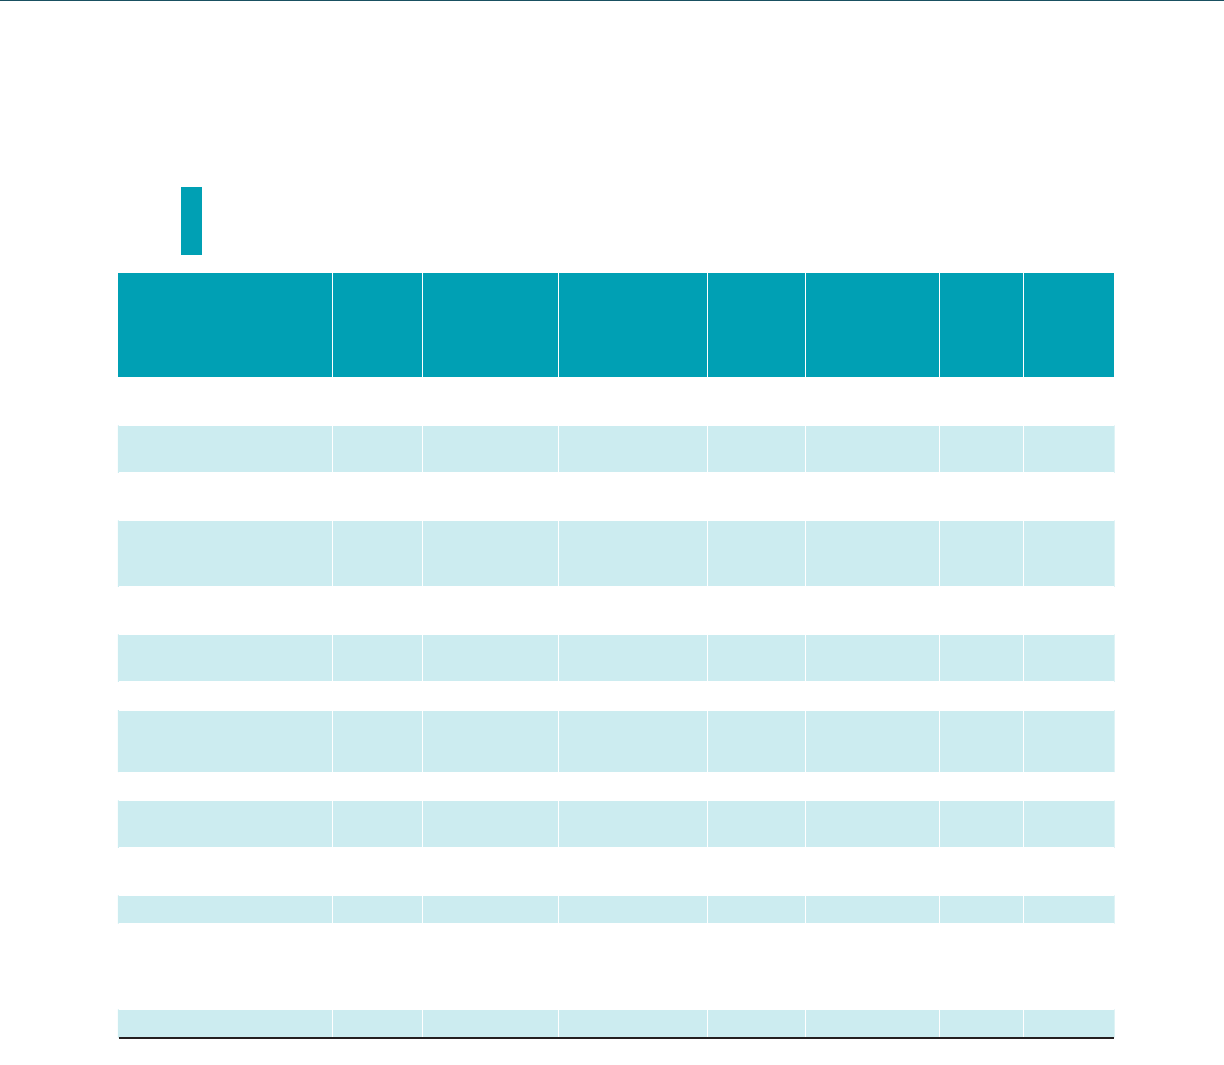
Table 3 provides the employment of limited English-speaking Massachusetts residents by occupation and place
of work.
Occupation of Work for Adult LES Massachusetts Residents by Place of Work
2016
TABLE 3
Source: U.S. Census Bureau, 2012-2016 American Community Survey, BPDA Research Division Analysis.
Note: County groupings correspond to Place of Work PUMAs, the smallest available geography.
Berk-
shire
County
Franklin,
Hampden, &
Hampshire
County
Essex, Middle-
sex, Worcester,
Norfolk, Bristol,
& Plymouth
Counties
Suolk
County
Barnstable,
Dukes &
Nantucket
Counties
Out of
State
Total
Production & Transporta-
tion & Material Moving
260 3,324 39,498 10,829 438 16,570 70,919
Building & Grounds,
Cleaning & Maintenance
272 1,666 24,401 13,027 740 8,558 48,664
Food Preparation &
Serving
675 1,397 18,493 12,059 564 8,649 41,837
Healthcare Support,
Personal Care & Service, &
Protective Service
153 2,294 19,896 9,300 536 8,366 40,545
Natural Resources, Con-
struction, & Maintenance
105 1,122 16,873 5,628 915 8,442 33,085
Oce & Administrative
Support
146 1,020 12,806 5,718 149 6,428 26,267
Sales Related 43 1,318 11,602 4,758 452 6,258 24,431
Computer, Engineering, &
Science
81 326 10,272 4,765 72 4,008 19,524
Management 7 613 6,938 3,101 193 2,889 13,741
Healthcare Practitioners &
Technical
25 540 4,999 2,694 125 1,790 10,173
Education, Training, &
Library
3 457 4,099 2,276 67 2,766 9,668
Business & Financial - 94 3,285 2,054 - 1,622 7,055
Legal, Community & Social
Service, Arts, Design,
Entertainment, Sports, &
Media
21 237 2,710 1,490 75 2,073 6,606
Military - - 55 11 - 26 92
Total 1,791 14,408 175,927 77,710 4,326 78,445 352,607

Demographic Profile of Adult Limited English Speakers in Massachusetts
Source: U.S. Census Bureau, 2012-2016 American Community Survey, BPDA Research Division Analysis.
The median annual earnings of an employed LES adult living in Massachusetts is $25,000, signicantly less
than the median annual earnings of employed, English-procient adults—$45,000. Two-thirds of employed LES
residents make between $10,000 and $50,000 per year. Figure 8 shows the distribution of personal earnings
for employed Massachusetts residents by English prociency.
Personal Earnings of Employed Massachusetts Residents by English Prociency
2016
FIGURE 8
14%
32%
34%
11%
4%
2% 2%
12%
16%
26%
20%
11%
6%
9%
0%
5%
10%
15%
20%
25%
30%
35%
less than
$10,000
$10,000 to
$24,999
$25,000 to
$49,999
$50,000 to
$74,999
$75,000 to
$99,999
$100,000 to
$124,999
More than
$125,000
Limited English Speaking English Proficient

BostonPlans.org | 15
Personal Earnings of Employed Massachusetts Residents by English Prociency
2016
Limited English speaking workers are concentrated in lower-paying occupations such as building and grounds
cleaning and maintenance. However, even within the same occupation, limited English speakers make less than
those who speak English prociently. Sales occupations are an extreme example in which English procient
workers earn an average of $57,000 a year, while those with limited English earn an average of $31,000 a year.
Figure 9 shows the median earnings of Massachusetts resident full-time and full-year workers.
Median Earnings of Massachusetts Resident Full-Time Full-Year Workers by Occupation and
English Prociency (18+)
2016
FIGURE 9
Source: U.S. Census Bureau, 2012-2016 American Community Survey, BPDA Research Division Analysis.
$36,336
$25,348
$40,304
$57,099
$42,938
$43,143
$51,909
$60,455
$60,214
$87,660
$76,044
$73,002
$86,899
$27,457
$28,031
$30,228
$30,670
$31,145
$36,804
$37,166
$40,557
$50,379
$50,696
$57,251
$62,290
$81,314
$0 $20,000 $40,000 $60,000 $80,000 $100,000
Building & Grounds, Cleaning & Maintenance
Food Preparation & Serving
Healthcare Support, Personal Care & Service, Protective
Service
Sales Related
Production & Transportation & Material Moving
Office & Administrative Support
Natural Resources, Construction, & Maintenance
Legal, Community & Social Service, Arts, Design,
Entertainment, Sports & Media
Education, Training, & Library
Management
Healthcare Practitioners & Technical
Business & Financial
Computer, Engineering, & Science
Limited English Speaking English Proficient

Demographic Profile of Adult Limited English Speakers in Massachusetts
Approximately 310,273 limited-English speaking adults work in Massachusetts, 95 percent of whom also live
in Massachusetts, and ve percent of whom commute from nearby states. Limited English speakers make up
nine percent of the people working in Massachusetts.
The industries in Massachusetts employing the most LES workers are accommodation and food services (47,000),
health care and social assistance (47,000), manufacturing (39,000), and retail trade (32,000). The industries
in Massachusetts with the highest share of workers who are limited English speakers are accommodation
and food services at 22 percent, followed by administrative support and waste management at 18 percent.
LES workers are also over-represented in other services, wholesale trade, natural resources,
4
construction,
manufacturing, and transportation & warehousing. Limited English speakers working in Massachusetts are
underrepresented in industries such as professional, technical, and scientic services, education, nance and
insurance, information, and public administration. Figure 10 illustrates the share of workers in each industry
that are limited English speakers.
4
Agriculture, Forestry, Fishing & Hunting and Mining, Quarrying, and Oil & Gas Extraction
Limited English Speaking Adults Working in Massachusetts
Share of Limited English Speaking Workers in Massachusetts Industries
2016
FIGURE 10
Source: U.S. Census Bureau, 2012-2016 American Community Survey, BPDA Research Division Analysis.
1.3%
2.2%
2.6%
2.8%
3.1%
3.5%
3.6%
3.8%
4.0%
8.1%
8.7%
11.2%
12.3%
12.3%
12.3%
12.8%
16.1%
17.9%
20.9%
0% 5% 10% 15% 20% 25%
Utilities
Arts, Entertainment & Recreation
Information
Finance & Insurance
Public Administration
Management of Companies & Enterprises
Educational Services
Professional, Scientific, Technical & Management Services
Real Estate & Rental & Leasing
Health Care & Social Assistance
Retail Trade
Transportation & Warehousing
Manufacturing
Construction
Natural Resources
Wholesale Trade
Other Services
Administrative Support & Waste Management
Accommodation & Food Services
8.8% of people working
in Massachusetts are
Limited English Speakers
BostonPlans.org | 17
Share of Limited English Speaking Workers in Massachusetts Industries
2016
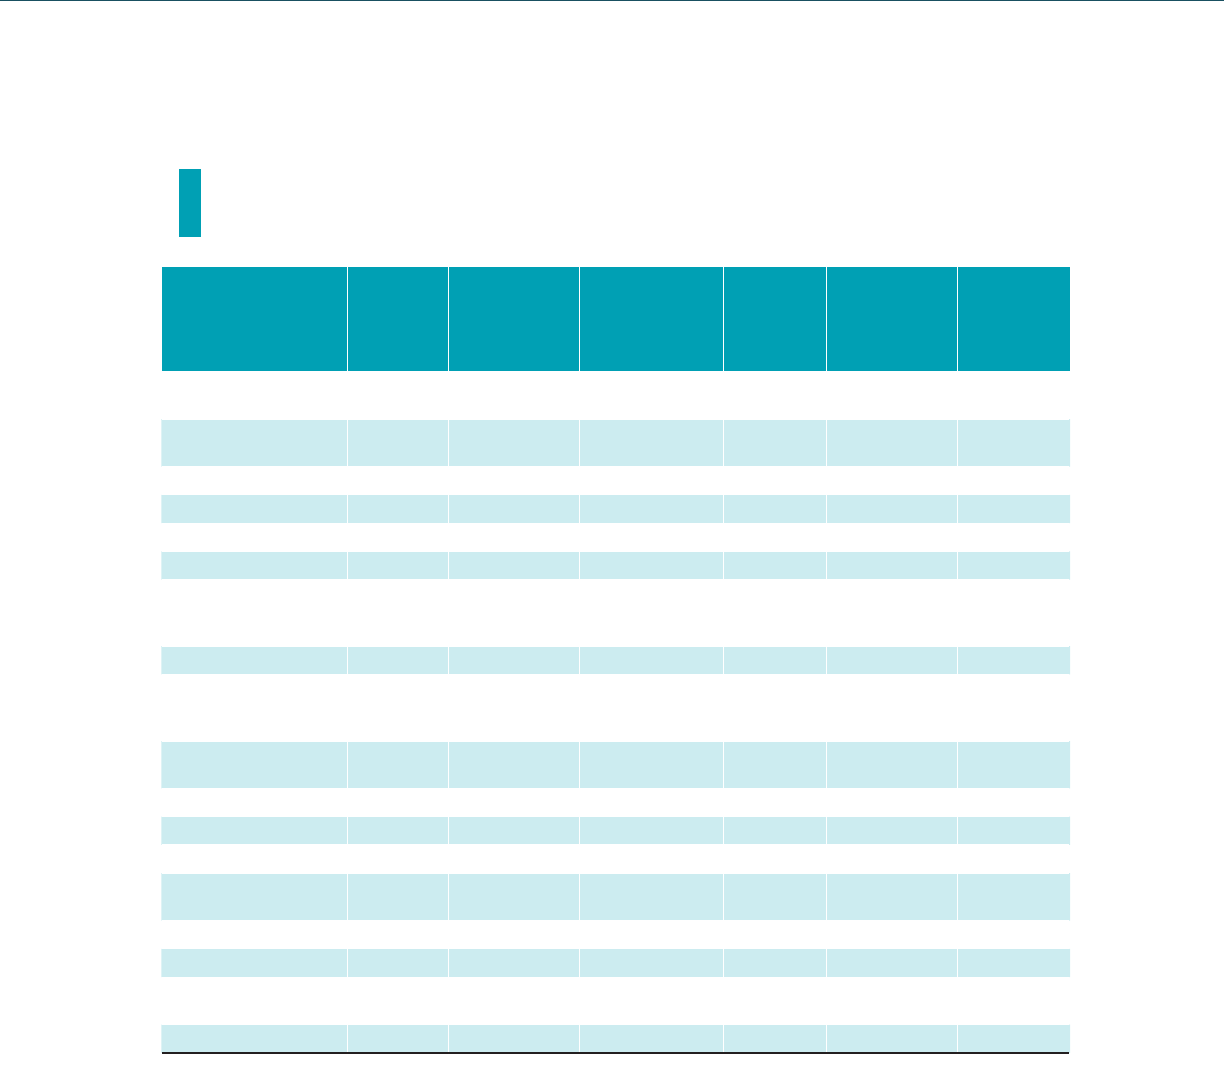
Limited-English Speaking workers are concentrated in the eastern part of the state: 92 percent work in Essex,
Middlesex, Worcester, Norfolk, Bristol, Plymouth or Suolk counties. In comparison, 85 percent of English-pro-
cient workers in Massachusetts hold jobs in these counties. Table 4 reviews the number of LES workers in all
industries by place of work in Massachusetts.
Berkshire
County
Franklin,
Hampden, &
Hampshire
Counties
Essex, Middle-
sex, Worcester,
Norfolk, Bristol,
& Plymouth
Counties
Suolk
County
Barnstable,
Dukes, &
Nantucket
Counties
All of
Massachu-
setts
Accommodation &
Food Services
290 1,889 23,997 20,369 943 47,488
Health Care & Social
Assistance
103 3,729 24,922 17,641 973 47,368
Manufacturing 96 2,518 31,914 4,307 64 38,899
Retail Trade 227 1,663 22,025 7,369 582 31,866
Other Services 61 428 20,199 5,748 509 26,945
Construction 134 152 17,646 6,813 1,434 26,179
Administrative Sup-
port & Waste Manage-
ment Services
0 406 15,633 5,648 722 22,409
Educational Services 0 1,158 7,889 5,396 31 14,474
Professional, Scientic,
Technical & Manage-
ment Services
13 747 7,800 4,923 107 13,590
Transportation &
Warehousing
0 404 6,624 5,296 0 12,324
Wholesale Trade 0 0 6,934 3,954 0 10,888
Finance & Insurance 0 298 2,786 2,444 0 5,528
Public Administration 0 308 2,183 1,939 0 4,430
Real Estate & Rental &
Leasing
0 146 597 1,662 0 2,405
Information 0 0 1,651 542 0 2,193
Natural Resources 0 249 1,206 134 0 1,589
Arts, Entertainment &
Recreation
125 0 1,148 0 144 1,417
Utilities 0 0 206 75 0 281
Total 1,049 14,095 195,360 94,260 5,509 310,273
Industry of Work for Adult LES Massachusetts Workers by Place of Work
2016
TABLE 4
Source: U.S. Census Bureau, 2012-2016 American Community Survey, BPDA Research Division Analysis.
Note: County groupings correspond to Place of Work PUMAs, the smallest available geography.

