
DISCONNECTED, DISADVANTAGED, AND
DISENFRANCHISED:
EXPLORATIONS IN THE DIGITAL DIVIDE
Mark N. Cooper
OCTOBER 11, 2000
ACKNOWLEDGEMENTS
Dhavan V. Shah of the School of Journalism and Mass Communication at the University of Wisconsin-
Madison oversaw the conduct of the survey research and provided analysis of that data for this report.
Major support for the conduct of the survey research was provided by the Digital Media Forum, a media
policy consortium established by the Ford Foundation. Additional support was provided by research
funding to Dhavan Shah from the School of Journalism and Mass Communication, University of
Wisconsin-Madison, was well as grants to William Eveland (Assistant Professor, School of Journalism and
Communication, The Ohio State University) from the Institute for Social, Behavioral, and Economic
Research (Social Science Research Grants Program) and the Department of Communication, University of
California at Santa Barbara. The author wishes to thank DDB-Chicago for access to some of the data
presented in this report.
Consumers Union is a nonprofit membership organization chartered in 1936 under the laws of the State
of New York to provide consumers with information, education and counsel about goods, services, health,
and personal finance; and to initiate and cooperate with individual and group efforts to maintain and
enhance the quality of life for consumers. Consumers Union's income is solely derived from the sale of
Consumer Reports, its other publications and from noncommercial contributions, grants and fees. In
addition to reports on Consumers Union's own product testing, Consumer Reports, with approximately
4.5 million paid circulation, regularly carries articles on health, product safety, marketplace economics
and legislative, judicial and regulatory actions which affect consumer welfare. Consumers Union's
publications carry no advertising and receive no commercial support.
The Consumer Federation of America is the nation's largest consumer advocacy group, composed of over
two hundred and forty state and local affiliates representing consumer, senior, citizen, low-income, labor,
farm, public power and cooperative organizations, with more than fifty million individual members.
The interpretation of the data are solely the responsibility of the author.

BACKGROUND AND METHODOLOGY
Dhavan V. Shah, Ph.D
Assistant Professor
School of Journalism and Mass Communication
University of Madison-Wisconsin
Voice: 608.262.0388 Fax: 608.262.1361
Internet: dshah@facstaff.wisc.edu
The mass diffusion of digital media and the explosive growth of the Internet are reshaping the lives and
lifestyles of many Americans. Over the last decade, the rise of digital technologies has fundamentally
altered how people work, play, communicate, socialize, and otherwise engage their communities. Major
transformations in the American media landscape have accompanied these changes. In response to these
trends, the Digital Media Forum, a media policy consortium funded by the Ford Foundation, funded a
large scale study of American’s Internet attitudes and behaviors, and their policy preferences concerning
digital media. To ensure this research was objective and systematic, the study was designed and
conducted independently by Professor Dhavan Shah, Ph.D., of the School of Journalism and Mass
Communication, University of Wisconsin-Madison.
The resulting study relies on national survey data collected in February 1999 and June 2000 from a single
panel of respondents to address a variety of issues that these changes in electronic media have
introduced. Topics examined by the broader study include: the extent of the digital divide in America,
support for programs to increase public access to the Internet, opinion concerning electronic privacy and
the restriction of media content, preferences about “broadband” and digital television, levels of support
for non-commercial uses of the Internet, the connection between the Internet and civic life, and concerns
about media mergers and Internet open access. The last of these topics is the focus of this report.
The February 1999
data were collected as part of an annual mail survey — the “Life Style Study” —
conducted by Marketfacts on behalf of DDB-Chicago, an international marketing communications
company. Via mail, a massive number of people were asked to express their willingness to participate in
mail or telephone surveys, and if so, to provide basic demographic information. A balanced sample was
then drawn from among the 500,000+ people agreeing to become part of the pre-recruited “mail panel.”
In order to ensure representativeness, the starting sample of approximately 5,000 mail panelists was
adjusted within the subcategories of race, gender, and marital status to compensate for expected
differences in return rates. The sample was also drawn to reflect demographic distributions within the 9
Census divisions of household income, population density, panel member’s age, and household size.
Applying this stratified quota sampling method, of the roughly 5,000 Life Style surveys distributed to mail
panelists, 3,388 usable responses were received, for a response rate of 67.8 percent. This rate of
response is considerably higher than the typical national survey.
For the June 2000
wave of the study, we engaged Marketfacts to recontact the individuals who
completed the February 1999 survey. Due to some erosion, 2,737 questionnaires were mailed out to
1999 Life Style Study respondents. To ensure a high response rate — and a more representative sample
— a substantial incentive was offered for completing the survey. The response rate for this survey was
70.1%, with 1,902 respondents completing the questionnaire. The data presented in this report focuses
on the respondents who completed both waves of the study. The margin of error for the results is about
±3.0% when using the full sample. For a validation of these Life Style data against other national survey
data, see Putnam (2000, Appendix 1).
TABLE OF CONTENTS
EXECUTIVE SUMMARY I
I. INTRODUCTION 1
A. GROWING CONCERN ABOUT THE DIGITAL DIVIDE
B. OUTLINE AND PURPOSE OF THE PAPER
II. DEFINING THE DIGITAL DIVIDE 3
A. CONNECTEDNESS IN CONCEPT
B. TECHNOLOGY OWNERSHIP AND USE
III. DEMOGRAPHIC CORRELATES AND CAUSES OF CONNECTEDNESS 5
A. CURRENT CONNECTION
B. INTENTION TO GET CONNECTED
IV. CONSEQUENCES OF BEING DISCONNECTED 15
A. PARTICIPATING IN CYBERSPACE
B. CYBERSPACE MAY BE INCREASE INEQUALITY OF
OPPORTUNITY
V. CONCLUSION 21
LIST OF TABLES
1. DIGITAL DIVIDE DEFINED BY INTERNET CONNECTION 4
2. CURRENT AND FUTURE CONNECTEDNESS 10
3. CONSEQUENCES OF BEING DISCONNECTED: 16
ACTIVITIES IN PHYSICAL SPACE AND CYBERSPACE
4. ATTITUDES TOWARD TECHNOLOGY 18
LIST OF FIGURES
1. INCOME, RACE AND CONNECTEDNESS 7
2. INCOME, AGE AND CONNECTEDNESS 8
3. INCOME, CHILDREN AND CONNECTEDNESS 9
4. DIFFUSION OF COMPUTER OWNERSHIP AND INTERNET USE 12
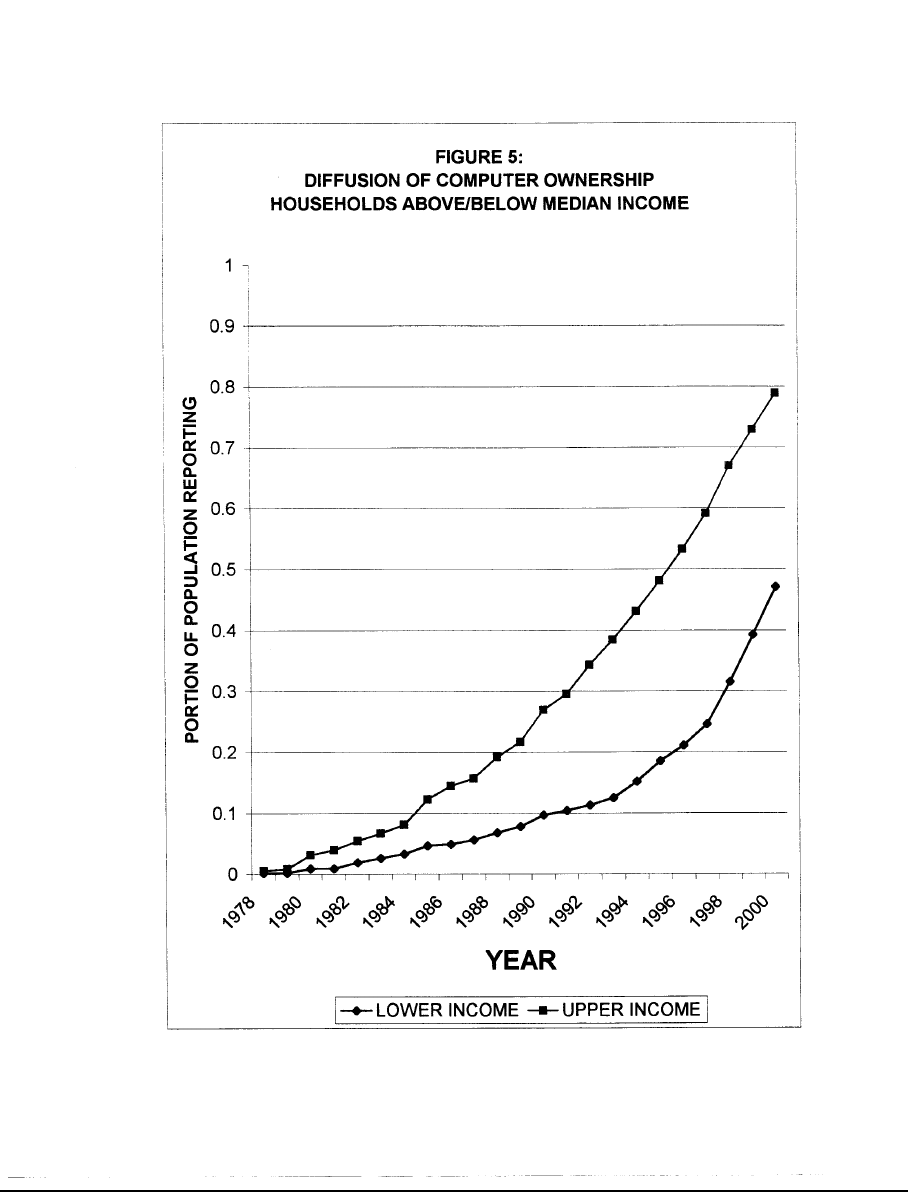
5. DIFFUSION OF COMPUTER OWNERSHIP: 13
HOUSEHOLDS ABOVE/BELOW MEDIAN INCOME
6. DIFFUSION OF INTERNET USE: 14
HOUSEHOLDS ABOVE/BELOW MEDIAN INCOME
7. CONCEPTUAL MODEL OF FUTURE INTERNET ADOPTION 20
COMBINING DEMOGRAPHIC AND ATTITUDINAL FACTORS

i
EXECUTIVE SUMMARY
From the first moment that the Internet showed potential as a commercial medium and
as a platform for public communications, policymakers have been debating the question of
whether differential access to the Internet poses a public policy problem. The public policy
debate over the digital divide stems from concerns that the denial of access to the emerging
digital society diminishes the economic chances or restricts the ability to participate in civic and
political life of those who are excluded from online activity. Furthermore, it is a concern that
certain demographic groups are systematically excluded from participation.
This paper uses the results of a large and detailed national survey to explore the nature
and impact of the digital divide.
♦ With a precise empirical definition, it documents the existence of the digital divide and
demonstrates that it is not likely to disappear any time soon.
♦ A direct comparison of a broad range of cyberspace and physical space activities for
commerce, information gathering, education, civic discourse and political participation,
shows that the disconnected are, in fact, disadvantaged and disenfranchised.
THE DIGITAL DIVIDE EXISTS AND PERSISTS
The
Fully Connected
constitute 36% of the population with an Internet Service
Provider or high speed Internet access at home.
The
Partially Connected
constitute 17% with basic Internet or e-mail service at home.
The
Potentially Connected
constitute 21% who have no Internet service, but do own
a computer at home or have a cellular phone.
The
Disconnected
constitute 26% who do not have any Internet service and do not
have a computer or a cell phone.
There are sharp differences in demographics across the groups, which can be
highlighted by contrasting the disconnected to the fully connected (see Table ES-1). Lower
income, elderly and minorities are more likely to be among the disconnected.
TABLE ES-1: DEMOGRAPHICS OF THE DIGITAL DIVIDE
DISCONNECTED FULLY CONNECTED
MEAN INCOME ($000) 25.5 45.2
AT LEAST COLLEGE GRAD (%) 13 46
BLACK (%) 12 7
AGE (Years) 53 44
MANAGERIAL OCCUPATION (%) 8 33
Patterns of connection to the Internet in the recent past (see Figure ES-1) and
intentions to get connected in the near future support the conclusion that, while digital
technologies are spreading through the population, the divide persists for some groups and is
not likely to disappear in the near future. The diffusion of Internet use indicates that those in

ii
iii
the bottom half of the income distribution are lagging behind by a half decade and that a
substantial part of the population will remain disconnected. Forty percent of the respondents
say they do not have the Internet at home today and they do not intend to get connected in
the next four years.
THE DISCONNECTED ARE DISADVANTAGED AND DISENFRANCHISED
The digital divide is an important policy issue because the Internet has already become
a significant means of communications and commerce in society. Households with access use it
for important personal, cultural and civic activities while those without access are at a
disadvantage in conducting similar daily activities. They cannot shop as effectively or
conveniently, are not offered attractive pricing plans, cannot gather information or contact
public officials and other people as effectively. They become less effective consumers and
citizens relative to their fellow consumers who have access.
Table ES-2 shows that there are very substantial differences between groups in their use
of the Internet. If using the Internet is helpful for conducting the economic and political
activities identified in Table ES-2, it is quite clear that the disconnected are at a disadvantage
and are being disenfranchised.
At the same time that the data document the dramatic difference between participation
in physical space and cyber space, they also show that the difference in participation in
cyberspace is not a mere reflection of a lower level of participation among these groups in real
space. The disconnected and potentially connected households do participate a little less in
physical space, but not nearly as much less as they do in cyberspace. With the shift of activity
to the Internet that has already occurred and the prospect of even more dramatic shifts in the
future, the threat that the disconnected are disadvantaged and disenfranchised grows.
♦ The problem is not that the disconnected do not participate in physical space, it is
that they cannot participate in cyberspace. People who are able to participate in
physical space are becoming disadvantaged and disenfranchised in cyberspace.
The respondents recognize this as a potential problem. Almost two-thirds of respondents
express the concern that technological progress can have the effect of increasing the gap
between rich and poor (see Table ES-3). Those not intending to get connected express the
greatest concern about this gap (68 percent agree), but even those currently connected express
concern (60 percent). Being left behind by the “information revolution” is also a concern
expressed by 57 percent of the respondents. Most interestingly, the group which expresses the
greatest concern about this gap (71 percent) is the group that intends to get connected in the
near future.
TECHNOLOGY ATTITUDES AND THE DIGITAL DIVIDE
The existence and persistence of the gap is not for lack of appreciation among those
who are disconnected that they are missing out on something important (see Table ES-3).
Respondents have a very strong appreciation for the importance of technology in general and
computers in particular. Those who intend to get connected express exactly the same level of
appreciation as the currently connected. This pattern holds for both computers and the
Internet.

iv
TABLE ES-2
CONSEQUENCES OF BEING DISCONNECTED
ACTIVITIES IN PHYSICAL SPACE AND CYBERSPACE
(Percent of Respondents Reporting Activity; Cyberspace in Bold)
Disconnected Potentially Partially Fully
BASIC SKILLS
Ever used the Internet 49 65 95 97
Don’t have a clue what the Internet is about 58 42 14 12
Use Internet at work 11 27 43 47
Use Internet in public 7 15 18 15
PERSONAL PRODUCTIVITY
Searched for a Job online 14 13 23 28
Searched for business info online 21 30 46 52
COMMERCIAL ACTIVITY
Made an online purchase 11 19 53 57
Visited website seen in an Ad 14 25 64 62
Visited website seen in a Program 17 28 65 67
INFORMATION GATHERING
Read a newspaper 92 94 97 97
Obtained news or sport results online 25 30 60 65
Read a news magazine 62 67 72 79
Visit a news website 18 25 62 70
Attended a lecture 29 44 55 55
Obtained educational information online 26 42 72 73
INTERACTING WITH GOVERNMENT
Contacted a local public official 31 35 40 40
Visited website of a gov't agency 13 17 36 40
CIVIC DISCOURSE
Wrote a letter to the editor 20 18 24 27
E-mailed a Newspaper 8 6 15 16
Discussed politics with a neighbor 46 47 56 50
Discussed politics in an e-mail 7 4 9 12
POLITICAL EXPRESSION
Circulated a petition for a politician 10 11 12 12
Signed or forwarded a petition online 5 5 9 14
Attended a political rally 22 23 18 19
Visited a politician’s website 8 7 18 19

v
TABLE ES-3
ATTITUDES TOWARD TECHNOLOGY
INTERNET STATUS
NOW IN 4 YEARS NOT 4 YEARS
TECHNOLOGY AND THE DIVIDE
Technology advances increase the gap between rich and poor 60 63 68
I worry that some people will be left behind by the 55 71 63
“information revolution”
TECHNOLOGY IMPORTANCE
If you want to be successful nowadays, you need 91 91 83
to understand technology
Children learn more when they have access to technology 87 87 84
COMPUTERS
We’d be better off without computers (disagree) 87 87 68
Computer skills are vital for tomorrow 96 96 93
INTERNET/ACCESS
I feel the Internet can help enhance my career 83 82 51
I feel the Internet can help enhance my education 59 62 32
TECHNOLOGY SKILLS
I consider myself computer-savvy 57 30 21
I Don’t’ have a clue what the Internet is about and 87 70 56
what it can do for me (disagree)
The Internet is too expensive 52 65 66

vi
The disconnected appear somewhat different in their attitudes toward technology. They
express slightly less appreciation for the importance of technology and computers, but a great
deal less belief that the Internet can do them good. While about half of those on the Internet
say it is too expensive, about two-thirds of those not on the net feel this way.
There are much larger differences across the groups in terms of knowledge and
command of the technology. The disconnected do not have the resources and they lack the
skills. They fully appreciate technology and computers, but less so the Internet. Their limited
experience may account for the latter difference.
In fact, the computer appears to play a key role in getting on line. Four fifths of those
who have computers are on the Internet. Among those who do not have a computer,
respondents who say they will get connected within the next four years, also say,
overwhelmingly (86 percent), they will get a computer
in that same time period. Among those
who do not have a computer and who say they will not get connected in the next four years,
the overwhelming majority (81 percent) also say they will not get a computer
in that time
period. In essence getting people PC hardware and training is the key.
CONCLUSION
As an empirical investigation into the nature of the digital divide, this study does not
offer a specific set of policy recommendations. The objective is to establish an appreciation of
the nature and impact of the digital divide.
♦ While computer ownership and Internet use continue to grow, the "digital divide" that
separates those Americans connected to the Internet from those who are not persists
and is not likely to disappear any time soon.
♦ The gap puts millions of Americans at a serious disadvantage in our increasingly “online”
society.
♦ The more important online activity becomes, the more problematic the digital divide will
be if it persists.
♦ Those at risk are in vulnerable groups – lower income, elderly and minorities.
Understanding that these vulnerable groups are harmed by their lack of access to
technology becomes the starting point for seeking cost-effective avenues to address this
deprivation. The steps to be taken to overcome the digital divide emerge from the attitudes
toward and experience with information-age technologies.
♦ The digital divide is not the result of a failure of those without access to appreciate the
importance of technology, rather it results from a maldistribution of skills and
opportunities.
♦ Public policy to close the digital divide must give people the human capital skills to use
information age technologies, the experience to make them comfortable with these
technologies and the resources to obtain the necessary hardware at home, where they
conduct their daily activities.

1
I. INTRODUCTION
A. GROWING CONCERN ABOUT THE DIGITAL DIVIDE
From the first moment that the Internet showed potential as a commercial medium
and as a platform for communications, policymakers have been debating the question of
whether differential access to the Internet poses a public policy problem. Reactions to a
Washington Post
article summarizing the findings of a mid-1999 report on the digital divide
suggest how prominent the debate has become. In a front page story, the newspaper
summarized a report from the National Telecommunications Information Administration as
follows:
Despite plummeting computer prices and billions of dollars spent wiring public
schools and libraries, high-income Americans continue to predominate in the online
world.
The findings were immediately cast in highly charged public policy terms by
President Clinton:
There is a growing digital divide between those who have access to the digital
economy and the Internet and those who don’t, and that divide exists along the
lines of education, income, region, and race… If we want to unlock the potential of
our workers, we have to close that gap.
By contrast, a spokesman for the ultraconservative Cato institute – Executive Vice
President David Boaz – dismissed the notion of the digital divide:
We’ve got a new technology spreading more rapidly than any new technology has
spread in history. And of course, it doesn’t spread absolutely evenly. Richer people
have always adopted new technology first – and that’s not news. There’s no such
thing as information haves and have-nots, there are have-nows and have-laters.
The families that don’t have computers now are going to have them in a few years.
Half a decade earlier, Manuel Castells, Professor of Sociology and Planning at the
University of California, Berkeley and author of a three volume work on
The Rise of the
Network Society
, anticipated this rancorous debate. He noted that timing in the distribution
and adoption of technology is a critical factor in determining economic chances, especially in
a digital age.
There are large areas of the world, and considerable segments of the population,
switched off from the new technological system . . . Furthermore, speed of
technological diffusion is selective, both socially and functionally. Differential timing
in access to the power of technology for people, countries, and regions is a critical
source of inequality in our society (p. 34).
In the digital age, waiting “a few years” for technology to trickle down may seriously
impede the economic aspirations of the “have laters.” “Having later” may be almost as bad
2
as “having not” because the good opportunities are gone and the patterns of activity are set,
leaving latecomers excluded and switched off.
The important point about the digital divide is not simply that some people have the
technology and others do not, but that not having it puts people at a disadvantage and cuts
them off from participation in important economic, social, cultural and political activities.
B. OUTLINE AND PURPOSE OF THE PAPER
This paper uses the results of a large and detailed national survey to explore the
nature and impact of the digital divide.
Section II presents a new, empirical definition of the digital divide. It documents the
existence of the divide.
Section III presents an examination of the demographic correlates and causes of the
digital divide. While it is clear that digital technologies are spreading through the population,
it is also clear that for some groups the divide persists and is not likely to disappear in the
near future.
Section IV examines the consequences of the divide. By presenting a direct
comparison of a broad range of commercial, informational, educational, civic and political
activities of individuals in physical space to those in cyberspace, it shows that the
disconnected are, in fact, disadvantaged and disenfranchised.
The intensity of the digital divide debate stems from the intersection of several
factors. It is clear that the Internet and activities in cyberspace are transforming society
powerfully and rapidly. Because the Internet has been an open and accessible place for new
forms of expression, it was hoped (believed) that it would democratize society and equalize
opportunity. The maldistribution of access to cyberspace flies in the face of that hope. In
fact, because the opportunity to participate is less equally distributed in cyberspace than in
physical space, the persistence of this problem may make matters worse. It is a new source
of inequality in society.
At the start of the 20
th
century, an industrial age was underway. Economic growth
was matched with a broad (but imperfect) expansion of economic opportunity and political
participation. At the start of the 21
st
century, as the Internet age begins, we are faced with
a similar challenge. Because things move so fast in cyberspace, the need to respond to the
challenge is urgent.
The purpose of this study is not to assign fault for the digital divide, rather it is to
understand its nature, persistence and consequences. Appreciation of the impact of the
divide should convince policymakers that action is necessary to close it. An understanding of
the causes of the divide should help choose the policies that will accomplish the goal of
eliminating the divide effectively and quickly.

3
II. DEFINING THE DIGITAL DIVIDE
A. CONNECTEDNESS IN CONCEPT
About eighteen months ago, the Consumer Federation of America and Consumers
Union published a report entitled
The Digital Divide Confronts the Telecommunications Act of
1996: Economic Reality vs. Public Policy
.
1
In that analysis households were divided into four
categories primarily on the basis of their telecommunications usage – whether or not they
had more than one phone line and a cell phone – as well as Internet usage.
Since that report was issued, the debate over the digital divide has been heated, with
intensive scrutiny of a number of technology characteristics of population groups being
considered. As the debate has shifted more toward the growth of e-commerce and the role
of high-speed networks, attention has been focused on computer ownership, Internet
usage, and the convergence of communications and video entertainment into interactive TV.
We believe it is now more relevant to focus on connectedness to computer networks
in defining the digital divide. These categories correspond closely to our past categories of
telecommunications usage, but provide greater focus on newer services. Accordingly, we
developed a scale of actual and potential connection to the Internet using four categories:
Fully Connected
- Respondents who report that they have a commercial
Internet Service Provider or high speed Internet access at home.
Partially Connected
- Those who have basic internet service or basic e-mail
service at home.
Potentially Connected
- Those who have no Internet service, but do own a
computer at home or have a cellular phone.
Disconnected
- Those who do not have any Internet service and do not
have a computer or a cell phone.
We use cellular connectedness to supplement the assessment of potential Internet
connectedness for two reasons. First, as the Internet moves increasingly to wireless
Internet platforms, these people will have a device for connection to the Internet. Second, a
cellular user's ability to pay the cost of a cell phone indicates a certain amount of
discretionary income that the consumer is willing to spend on communications services.
B. TECHNOLOGY OWNERSHIP AND USE
Table 1 provides a description of the characteristics of these groups across four
dimensions – demographics and each of the major technologies that are converging in the
Internet Century. It also provides a comparison to our earlier discussion of the digital divide.
1
February 1999.

4
TABLE 1
DIGITAL DIVIDE DEFINED BY INTERNET CONNECTION
(IN PERCENT, UNLESS OTHERWISE NOTED)
Dis- Potentially Partially Fully
Connected Connected Connected Connected
DIGITAL DIVIDE DEFINED
BY INTERNET/COMPUTER
(2000)
DEMOGRAPHICS
POPULATION 26 21 17 36
MEAN INCOME (x1000) $25.5 $34.3 $39.6 $45.2
AT LEAST COLLEGE GRAD 13 26 44 46
BLACK 12 11 4 7
AGE (in Years) 53 47 45 44
MANAGERIAL 8 22 26 33
HOUSEHOLD SIZE 2.1 2.5 2.7 2.8
COMPUTER/INTERNET
COMPUTER 0 59 95 96
INTERNET COMMERCIAL 0 0 0 100
INTERNET BASIC 0 0 100 69
MODEMS 0 30 75 84
COMMUNICATIONS
CELL PHONES 0 72 58 69
FAX 2 16 22 33
LONG DISTANCE 71 85 88 89
VIDEO ENTERTAINMENT
CABLE TV 56 64 63 78
DIGITAL CABLE 4 7 4 15
SATELITE 8 15 23 20
MVPD HOUSEHOLDS 62 73 78 87
DIGITAL DIVIDE DEFINED
BY COMMUNICATIONS
(1999)
DEMOGRAPHICS
POPULATION 45 16 15 24
MEAN INCOME (X1000) $22.5 $41.2 $35.8 $53.8
COMPUTER/INTERNET
INTERNET 0 0 62 87
COMMUNICATIONS
CELL PHONES 0 100 10 91
FAX 5 10 28 50
VIDEO ENTERTAINMENT
MVPD HOUSEHOLDS 63 76 74 86

5
Just over one-quarter (26 percent) of the respondents are disconnected, having no
Internet service at home, no computer and no cellular phone. Just over one-fifth (21
percent) are potentially connected (having either a computer or a cell phone, but no
Internet). Just over one-sixth (17 percent) of the respondents are partially connected. Over
one-third (36 percent) of households are fully connected.
The categories of connectedness correlate with a number of technology and other
household characteristics. There is a steady rise of possession/consumption of each of the
categories of technologies as one moves from the disconnected to the fully connected.
Among the fully and partially connected, computers are ubiquitous, with 96 percent
reporting a computer at home. Modems are also widespread in these two groups, with over
three quarters possessing this communications device. Fifty-nine percent of the potentially
connected have a computer and half of these have a modem.
Embedded in these numbers is the fact that 81 percent of those who have a
computer are either fully or partially connected. In other words, once respondents have a
computer, they are very likely to be connected.
Twenty-nine percent of the disconnected respondents report they do not have a long
distance telephone service (they may use dial-around) and 38 percent do not have a
multichannel video service (cable or satellite). Among the fully connected, 11 percent say
they do not have a long distance service (they may use a dial-around service or their cell
phones). Thirteen percent say they do not have a multichannel video service.
Although different characteristics were used to create the definition of the digital
divide in this paper (here, Internet-based v. rates of telecommunications usage in the earlier
paper), there are strong similarities with the characteristics of the groups identified in the
earlier study. The ‘have-nots’ in each analysis have much lower levels of consumption of
each of the technologies.
III. DEMOGRAPHIC CORRELATES AND CAUSES OF CONNECTEDNESS
The fact that there are differences between groups in their ownership and use of
technology is not a major public policy concern in itself. Rather, the public policy debate
over the digital divide stems from concerns that failure to participate in the emerging digital
society constitutes a deprivation, imposes a hardship or diminishes the economic chances of
those who are not participating. Furthermore, it is a concern that certain demographic
groups are excluded from participation.
A. CURRENT CONNECTION
There are sharp differences in demographics across the groups on all dimensions.
Table 1 lists several demographic characteristics that have an independent and significant
effect on connectedness, as discussed below.

6
Income is lowest in the disconnected group ($25,500), highest in the fully connected
group ($45,200). Those who are fully and partially connected are much more likely to have
at least a college degree and be employed in managerial or professional occupations. The
fully and partially connected are less likely to be black. Disconnected households are older
and tend to be smaller.
The six demographic characteristics discussed above have statistically significant
effects in a multiple regression analysis.
2
They explain about one-quarter of the variance in
connectedness. Other demographics that were tested but did not have statistically
significant effects once these variables are taken into account include gender, employment
status, urban/rural location, residence tenure, and Hispanic origin.
Figures 1, 2 and 3 give a taste of the multivariate analysis for three demographic
variables that are frequently invoked in public policy debates over the digital divide – race,
age and the presence of children in the home. Figure 1 depicts the relationship between
income, race and connectedness. Income is clearly the more important factor, but race is
also significant. For the lowest income group and several of the highest, blacks are clearly
more likely to be disconnected.
Figure 2 depicts the relationship between income, age and connectedness. Older
respondents are much more likely to report being disconnected. For those 65 and over, the
gap is quite large, particularly for middle income respondents, who report a gap of 20+
percentage points. Even for the middle-aged group (45-64) compared to the youngest
group (18-44) there is a significant gap at all income levels.
Figure 3 shows that households with children are significantly more likely to have a
computer, beyond the lowest income group. The differences are large (20 percentage
points or more) for most income groups.
2
The key results of the regression analysis are as follows.
CAUSES OF CONNECTIVITY
DEPENDENT VARIABLE = CONNECTEDNESS SCALE
BETA SIGNIFICANCE
INDEPENDENT VARIABLES
INCOME .288 .0000
AGE -.189 .0000
EDUCATION .153 .0000
RACE -.063 .0074
HOUSEHOLD SIZE .049 .0317
MANAGER .048 .0383
Multiple R = .48, R Square = .23

7

8

9
10
B. INTENTION TO GET CONNECTED
As noted in the introduction, some argue that the gap between those who are
connected and those who are not is closing rapidly and there is no need for public policy to
intervene. These survey data do not support that optimism. Approximately 47 percent of
the respondents are not connected today. Just one in eight of those respondents expects to
be connected within four years (see Table 2). In other words, forty percent of the
respondents do not expect to be connected four years from now. In cyberspace that is a
long time.
TABLE 2
CURRENT AND FUTURE CONNECTEDNESS
(PERCENT OF TOTAL POPULATION)
NOT NOW WILL GET WILL NOT GET
CONNECTED CONNECTED CONNECTED
WITHIN 4 YEARS WITHIN 4 YEARS
POTENTIALLY 21 5 16
CONNECTED
DISCONNECTED 26 2 24
TOTAL 47 11 40
The potentially connected group is much more likely to say they intend to get
connected. Just under a quarter of that group intends to get connected. In contrast, among
the disconnected only one in thirteen expresses this intention. In the potentially connected
group there is no significant difference between those who have a computer (23 percent)
and those who have a cell phone (25 percent) in their intention to get connected.
While people's perceptions of their futures are not necessarily equivalent to their
actual futures— they could get wired much more quickly than they expect— we believe that
perceptions are critical. If people do not believe that getting online is realistic for them, they
are less likely to pursue these kinds of opportunities.
Applying the same demographic model to future intentions to get connected as was
applied above to current connectedness reveals a rather different outcome. While income,
age and education remain significant factors, the other demographic factors are not
significant. The magnitude of the effects are smaller as well. Overall, these demographic
factors explain one-twelfth of the variance in intention to get connected. The impact of

11
income is cut in half and that of education reduced by about one-third. The impact of age
remains about the same.
3
Listening to what people say they intend to do is one indicator of what may happen
in the years ahead. Looking at what people have done in the recent past is another indicator
of what may happen. Figures 4, 5, and 6 show the diffusion curves for computers and
Internet use for the total population and for the households above and below the median of
household income. These are based on responses to questions that asked “when did you
first get a computer” and “when did you first use the Internet.” The charts reflect the date
of first adoption for those who still have the technology. We choose income as the control
variable in the analysis because it is far and away the most important causal factor in
technology adoption.
Figure 4 shows rapid diffusion at the overall societal level. Figures 5 and 6 show that
there is a substantial digital divide. Looking at the figures, one could argue that there is a
five-year divide. That is, those with incomes below the median achieve adoption rates about
five years after those with incomes above the median.
Figures 5 and 6 provide the empirical basis for the perception that the divide is
growing. Measured in absolute terms, the gap has grown to 40 percentage points. The
Figures also provide the basis for claiming that the gap will begin to close. Adoption among
households with above median income will begin to top out. Adoption among households
with incomes below the median will continue and start to close the gap, if
the bottom half
continues to behave as the top half did.
If the diffusion curve for below median income households follows that of households
above median, we would expect a 50-60 percent penetration rate in the lower income
groups in four years. At that point, this group might contribute about 20-25 percent of the
total population to the not-connected group. The above median households will likely not
get to 100 percent.
4
This group might contribute another 5 to 10 percent of the total
population to the not-connected group. This suggests the disconnecteds would still
constitute 25 to 35 percent of the population. Thus, the respondents may be a little
3
The key results of the regression analysis are as follows.
CAUSES OF INTENTION TO BECOME CONNECTED
DEPENDENT VARIABLE = PLAN TO GET INTERNET IN THE NEXT 4 YEARS
BETA SIGNIFICANCE
INDEPENDENT VARIABLES
INCOME .15 .0000
AGE -.199 .0000
EDUCATION .103 .0032
Multiple R = .30, R Square = .09
4
For example, only 90 percent of the households with incomes above the median have a long distance company,
while 77 percent of the below median income households do.

12
13

14

15
pessimistic in what they say about their intentions to connect, but they are not too far off
from the historical pattern. There will still be a substantial gap well out into the future for
lower income households.
The big ifs
in the analysis are – when do the curves start to top out? Will the below median
group sustain the same rate of diffusion as the above median income group? The answers to
these questions will hinge on factors like income growth, the cost of hardware to get
connected and the price of being connected.
IV. CONSEQUENCES OF BEING DISCONNECTED
What does it matter if a household is disconnected from the network? The Internet
has already become an important means of communications and commerce in society and
households that do not have access have more difficulty conducting their daily activities.
They cannot shop as effectively or conveniently, are not offered attractive pricing plans,
cannot gather information or contact public officials and other people as effectively. They
become less effective consumers and citizens relative to their fellow citizens who have
access.
The deprivation is not only relative, it may be absolute. They may be cut off from
important personal, cultural and civic activities. Businesses may effectuate market
segmentation by restricting their activities to cyberspace, since this screens out less
attractive customers. For example, instead of 800 numbers, advertisers may give web sites
for further information; jobs may be listed on websites, but not advertised in physical space.
As the Internet becomes the dominant means of communication and commerce in the 21
st
century, the cost of being cut off would rise in relative and absolute terms.
To examine this issue we looked at activities in which respondents engage in
cyberspace and compared them to activities in physical space. Given the general orientation
of the debate over the digital divide, we have focused on what might be called economic and
political activities, rather than social activities. For example, economic activities include
basic skills for using the Internet, personal productivity improvement and commercial
activity. Political activities include civic discourse and political expression. Information
gathering and interacting with government could be considered to fall in both categories.
A. PARTICIPATING IN CYBERSPACE
Table 3 shows that there are very substantial differences between groups in their use
of the Internet. It is interesting to note that half of the disconnected and two-thirds of the
potentially connected report that they have used the Internet at some time. This is in
contrast to virtually all of those who are partially or fully connected. Although the
disconnecteds have used the Internet, they are more likely to say they do not understand
what it is about.

16
TABLE 3
CONSEQUENCES OF BEING DISCONNECTED
ACTIVITIES IN PHYSICAL SPACE AND CYBERSPACE
(Percent of Respondents; Cyberspace in Bold)
Disconnected Potentially Partially Fully
BASIC SKILLS
Ever used the Internet 49 65 95 97
Don’t have a clue what the Internet is about 58 42 14 12
Use Internet at work 11 27 43 47
Use Internet in public 7 15 18 15
PERSONAL PRODUCTIVITY
Searched for a Job online 14 13 23 28
Searched for business info online 21 30 46 52
COMMERCIAL ACTIVITY
Made an online purchase 11 19 53 57
Visited website seen in an Ad 14 25 64 62
Visited website seen in a Program 17 28 65 67
INFORMATION GATHERING
Read a newspaper 92 94 97 97
Obtained news or sport results online 25 30 60 65
Read a news magazine 62 67 72 79
Visit a news website 18 25 62 70
Attended a lecture 29 44 55 55
Obtained educational information online 26 42 72 73
INTERACTING WITH GOVERNMENT
Contacted a local public official 31 35 40 40
Visited website of a gov't agency 13 17 36 40\
CIVIC DISCOURSE
Wrote a letter to the editor 20 18 24 27
E-mailed a Newspaper 8 6 15 16
Discussed politics with a neighbor 46 47 56 50
Discussed politics in an e-mail 7 4 9 12
POLITICAL EXPRESSION
Circulated a petition for a politician 10 11 12 12
Signed or forwarded a petition 5 5 9 14
Attended a political rally 22 23 18 19
Visited a politician’s website 8 7 18 19

17
If using the Internet is helpful for conducting the economic and political activities
identified in Table 3, it quite clear that the disconnected are at a disadvantage and are being
disenfranchised. The ability of the disconnected to improve their lot, conduct commercial
activity, gather information, interact with government, engage in civic discourse and political
expression is restricted relative to online members of their community. This is over one-
quarter of the population. The potentially connected also suffer the disadvantage and
disenfranchisement, albeit at a slightly lower level than the disconnected. This is more than
one fifth of the population.
B. CYBERSPACE MAY BE INCREASING INEQUALITY OF OPPORTUNITY
Finding that households that are disconnected are much less likely to make use of the
Internet for a variety of activities considered important for personal improvement, economic
advancement and civic/political participation does not necessarily demonstrate a digital
divide. After all, these households are less educated and have lower incomes. This
difference in participation in cyberspace might simply be a reflection of their lower levels of
participation in real space. This would still be a public policy concern, but it would not be a
uniquely digital divide issue.
On the other hand, if cyberspace activity is much less evenly spread across the
population than physical space activity, then it is a uniquely cyberspace problem and it could
be very significant as the role of online activity expands in the “Internet Century.” People
who are not disadvantaged or disenfranchised in physical space are becoming so in
cyberspace. As society shifts more of its important activities into cyberspace, the inequality
between people grows. The deprivation may be relative and absolute. People can still do
their physical space activities, but they are at a disadvantage compared to those who can
get things done more easily. Eventually, they could be cut off as certain activities come to
exist only in cyberspace.
In fact, there is a dramatic difference between participation in physical space and
cyber space. The disconnected and potentially connected households generally participate a
little less in physical space,
5
but not nearly as much less as they do in cyberspace. The data
are consistent with the disadvantage/disenfranchisement argument. The problem is not that
the disconnected do not participate in physical space, it is that they cannot participate in
cyberspace.
The existence and persistence of the gap is not for lack of appreciation among those
who are disconnected that they are missing out on something important (see Table 4).
Respondents have a very strong appreciation for the importance of technology in general
and computers in particular. Those who intend to get connected express exactly the same
level of appreciation as the currently connected. This pattern holds for both computers and
the Internet.
5
The one clear exception is the percentage of disconnected who report attending a lecture.

18
TABLE 4
ATTITUDES TOWARD TECHNOLOGY
CURRENTLY WILL GET WILL NOT BE
CONNECTED CONNECTED CONNECTED
TECHNOLOGY IMPORTANCE
If you want to be successful nowadays, 91 91 83
you need to understand technology
Children learn more when they 87 87 84
have access to technology
TECHNOLOGY AND THE DIVIDE
Technology advances increase the gap 60 63 68
between rich and poor
I worry that some people will be left 55 71 63
behind by the “information revolution”
COMPUTERS
We’d be better off without computers 87 87 68
(disagree)
Computer skills are vital for tomorrow 96 96 93
INTERNET/ACCESS
I feel the Internet can help 83 82 51
enhance my career
I feel the Internet can help 59 62 32
enhance my education
I would like to receive Internet 37 64 33
service through my television
TECHNOLOGY SKILLS
I consider myself computer-savvy 57 30 21
Don’t’ have a clue what the Internet is 87 70 56
and what it can do for me
(disagree)
The Internet is too expensive 52 65 66

19
The disconnected appear somewhat different in their attitudes toward technology.
They express slightly less appreciation for the importance of technology in general and
computers, but a great deal less belief that the Internet can do them good. While about
half of those on the Internet say it is too expensive, about two-thirds of those not on the
Internet feel this way.
There is also a strong sense that technological progress can have the effect of
increasing the gap between rich and poor, with almost two-thirds of respondents expressing
this sentiment. Those not intending to get connected express the greatest concern (68
percent agree), but even those currently connected express concern (60 percent). Being
left behind by the “information revolution” is also a concern expressed by 57 percent of
respondents. Interestingly, while 55 percent of the currently connected express this concern
and 63 percent of those not intending to get connected do, 71 percent of those who intend
to be connected express this concern.
This suggests that the intention to get connected may be spurred by the urgent
desire not to be left behind. Consistent with this interpretation is the fact that they are much
more likely to state that they would like to have the Internet over their TV (64 percent). In
contrast, only 37 percent of the currently connected and only 34 percent of those not intend
to get connected say they want the Internet over their TV.
There are much larger differences across the groups in terms of knowledge and
command of the technology. The disconnected do not have the resources and they lack the
skills. They fully appreciate technology and computers, but they are less likely to see the
value of the Internet to them. Their limited experience may account for the latter difference.
The very large differences of opinion between those who intend to get connected and
those who do not on the prospects for educational or career enhancement are striking. This
may reflect the fact that these technologies do not play a large or apparent role in the
current occupation/situation of the disconnected. Those who intended to get connected are
twice as likely to be in managerial or administrative occupations (24 percent to 12 percent)
and much more likely to have graduated from college (33 percent to 19 percent).
The computer appears to play a key role in getting on line. Among those who do not
have a computer, respondents who say they will get connected within the next four years,
also say, overwhelmingly (86 percent), they will get a computer
in that same time period.
Among those who do not have a computer and who say they will not get connected in the
next four years, the overwhelming majority (81 percent) also say they will not get a
computer in that time period. This is perfectly consistent with the earlier observation that 81
percent of those who have a computer are connected.
In essence, getting people PC hardware and training is the key, since once they have
one, they get online, as suggested earlier. This may be driven by the perception and current
reality that the computer is an extremely important device for personal skills. While other
means of connection to the Internet may evolve, the computer is likely to continue to be an
important tool for activities other than getting connected. For the immediately relevant time
frame of public policy analysis, it appears to be the lever for connectedness.

20
Combining the earlier discussion of demographic factors with this analysis of
attitudinal factors, we can construct a “conceptual model” of future Internet adoption (see
Figure 7). The relationships included have been discussed in the earlier analysis in and are
also statistically significant in a multivariate analysis.
FIGURE 7
CONCEPTUAL MODEL OF FUTURE INTERNET ADOPTION COMBINING
DEMOGRAPHIC AND ATTITUDINAL FACTORS
EDUCATIONAL
ENHANCEMENT
EXPERIENCE
EDUCATIONAL SAVVY
ATTAINMENT
RACE
AGE COMPUTER INTERNET
CHILDREN
INCOME
OCCUPATIONAL
ATTAINMENT
OCCUPATIONAL
ENHANCMENT
Intention to get a computer is far and away the most important factor affecting
intention to get on line. Income affects both the intention to obtain a computer and the
intention to get on line. It is by far the largest effect on both. It provides the resources.
Educational attainment and prospects for educational enhancement also affect both.
Computer savvy affects the intention to get a computer, as does occupational attainment.
Prospects for occupational enhancement affect intention to get connected. Race, age and
children affect the intention to get a computer.

21
V. CONCLUSION
As an empirical investigation into the nature of the digital divide, this study does not
offer a specific set of policy recommendations. The objective is to establish an appreciation
of the nature and impact of the digital divide.
It is clear that, while computer ownership and Internet use continue to grow, the
"digital divide" that separates those Americans connected to the Internet from those who are
not persists and is not likely to disappear any time soon. This gap puts millions of Americans
at a serious disadvantage in our increasingly “online” society. Those at risk are in vulnerable
groups – lower income, elderly and minorities.
Understanding that these vulnerable groups are harmed by their lack of access to
technology becomes the starting point for seeking cost-effective avenues to address this
deprivation. The disconnected are disadvantaged and disenfranchised.
The steps to be taken to overcome the digital divide emerge from the attitudes
toward and experience with information-age technologies. The digital divide is not the result
of a failure of those without access to appreciate the importance of technology, rather it
results from a maldistribution of skills and opportunities. Public policy to close the digital
divide should build human capital by giving people the capital skills to use information age
technologies, the experience to make them comfortable with these technologies and the
resources to obtain the necessary hardware at home, where they conduct their daily
activities.
