
NOAA Technical Memorandum ERL
GLERL-20
SUMMARY OF GREAT LAKES WEATHER AND ICE CONDITIONS,
WINTER 1976-77
F. H. Quinn
R. A.
Assel
D. E. Boyce
G
. A.
Leshkevich
C.
R. Snider
D. Weisnet
Great Lakes Environmental Research Laboratory
Ann Arbor, Michigan
October 1978
UNITED STATES
NATIONAL OCEANIC AND
Enwonmen!al
Research
DEPARTMENT OF COMMERCE
AlMOSPHEAlC
ADMlNlSTRATlON
Latoratoiles
Juanita M.
Kreps.
Secretary
Rlchard
A. hank.
Admwliator
Wllmoi N Hess,
Director

NOTICE
The
NOAA Environmental Research Laboratories do not
approve,
recommend, or endorse
any
proprietary product or
proprietary material mentioned in this publication. No
reference shall be made to the NOAA Environmental Research
Laboratories, or to this publication furnished by the NOAA
Environmental Research Laboratories, in any advertising or
sales promotion which would indicate or imply that the NOAA
Environmental Research Laboratories approve, recommend, or
endorse any proprietary product or proprietary material
mentioned herein, or which has as its purpose an intent to
cause directly or indirectly the advertised product to be
used or purchased because of this NOAA Environmental Research
Laboratories publication.
ii

LANDSAT
fake
color
image of
ice
cover on Lake Michigan for 16
February 1977. The winter of
1976-77 produced a record
u.maZ
ice extent on Lake Michigan.

U.S. DEPARTMENT OF COMMERCE
National Oceanic and Atmospheric Administration
SUMMARY OF GREAT LAKES WEATHER AND ICE CONDITIONS, WINTER 1976-77
F. H. Quinn',
R. A.
Assell,
D. E.
Boyce2,
G. A.
Leshkevich',
C. R. Snider' , and D. Weisnet
3
October 1978
1
Great Lakes Environmental Research Laboratory
Environmental Research Laboratories
National Oceanic and Atmospheric Administration
2300
Washtenaw
Avenue
Ann Arbor, Michigan 48104
2
National Weather Service
National Oceanic and Atmospheric Administration
3
National Environmental Satellite Service
National Oceanic and Atmospheric Administration

CONTENTS
Page
1
1
Abstract
1.
INTRODUCTION
2.
SUMMARY OF METEOROLOGICAL CONDITIONS
2.1 Synoptic Study of the Winter
2.1.1 The Preparatory Phase
2.1.2
The Onset of Winter
2.1.3
The Northern Intense Phase
2.1.4
The Core of the Winter
2.1.5
The Receding Phase
2.1.6 The Precipitation Pattern
2.2
Freezing
Degree-Days
2.3 Climatic Anomalies and Comparisons
2.4 Comparison with Previous Winters
2.4.1
The Winter
of
1903-04
2.4.2
The Winter
of
1783-84
2.4.3
The Winter
of
1874-75
2.4.4
The Winter
of
1779-80
2.4.5
Character of Winters
3.
SUMMARY
OF ICE CONDITIONS
3.1 Data Collection Platforms and Processes
3.1.1 Visual Aerial Ice Reconnaissance
3.1.2 Side Looking Airborne Radar
3.1.3
Satellite Imagery
3.2 General Description
3.2.1 Fall Cooling Phase
3.2.2
Ice Formation and Breakup Phases
3.2.3
The Ice Cycle on Lake Superior
3.2.4 The Ice Cycle on Lake Michigan
3.2.5
The Ice Cycle on Lake Huron
3.2.6
The Ice Cycle on Lake St. Clair
3.2.7
The Ice Cycle on Lake Erie
3.2.8 The Ice Cycle on Lake Ontario
3.3 Comparisons with Previous Winters
128
iii
3
3
10
10
11
13
15
15
15
23
28
30
30
30
30
32
32
32
33
33
34
35
35
37
120
122
124
125
126
127

4.
CONCLUDING REMARKS
129
4.1 Effects on Lake
Commerce
129
4.2 Air-Lake (Water)
Interaction
135
4.3 Hydrology
138
5.
ACKNOWLEDGMENTS
139
6.
REFERENCES
139
6.1 Data Sources and
Supplemental
Bibliography
141
iv

FIGURES
1.
2a.
2b.
2c.
32.
3b.
32.
4a.
4b.
42.
52.
5b.
6.
7a.
7b.
7c.
7d.
Freezing degree-day accumulations, Green Bay, Wis.
7e.
Freezing degree-day accumulations, Milwaukee, Wis.
7s.
Freezing degree-day accumulations, Muskegon,
Mich.
7g-
Freezing degree-day accumulations,
Alpena,
Mich.
7h.
Freezing degree-day accumulations, Cleveland, Ohio.
7i.
Freezing degree-day accumulations, Buffalo, N.Y.
Geographic location chart for the Great Lakes.
Mean 700 mb heights, November 1976.
Mean 700 mb heights, December 1976.
Mean 700 mb heights, January 1977.
Normal 700
mb
heights, November 1976.
Normal 700 mb heights, December 1976.
Normal 700
mb
heights, January 1977.
Mean temperature
("C),
November 1976.
Mean temperature departure from normal
("C),
November 1976.
Mean temperature departure from normal
(a),
November 1976.
Minimum temperature, 9 January 1977
("C).
Minimum temperature, 17 January 1977
("C).
Precipitation excess or deficiency (cm water
equivalent), December 1976 through February 1977.
Freezing degree-day accumulations, Duluth, Minn.
Freezing degree-day accumulations, Marquette,
Mich.
Freezing degree-day accumulations,
Sault
Ste. Marie,
Mich.
Page
2
4
5
6
7
8
9
11
12
12
13
14
lb
18
19
19
20
20
21
21
22
22
V

7j.
Eta.
8b.
&.
9a.
9b.
9c.
l&Z.
lob.
lla.
llb.
llc.
lid.
lle.
llf.
llg.
llh.
lli.
ll,j.
Ilk.
112.
llm.
lln.
Freezing degreeday accumulations, Rochester,
Mean temperature
("C),
December 1976.
Mean temperature departure from normal
("C),
December 1976.
Mean temperature departure from normal
(u),
December 1976.
Mean temperature ("0, January 1977.
Mean temperature departure from normal
("C),
January 1977.
Mean temperature departure from normal
c(J),
January 1977.
Mean temperature
("C),
November 1976 through
January 1977.
Mean temperature departure from normal
("C),
November 1976 through January 1977.
Composite ice chart for 5 December 1976.
Composite ice chart for 12 December 1976.
Composite ice chart for 19 December 1976.
Composite ice chart for 26 December 1976.
Composite ice chart for 2 January 1977.
Composite ice chart for 9 January 1977.
Composite ice chart for lb January 1977.
Composite ice chart for 23 January 1977.
Composite ice chart for 30 January 1977.
Composite ice chart for
6
February 1977.
Composite ice chart for 13 February 1977.
Composite ice chart for 20 February 1977.
Composite ice chart for 27 February 1977.
Composite ice chart for
6
March 1977.
N.Y.
23
25
25
26
26
27
27
29
29
38
40
42
44
46
48
50
52
54
56
58
60
62
64
vi

110.
llp.
llq.
11r.
11s.
11t.
llu.
12a.
12b.
12c.
12d.
12e.
P
12f.
12g.
12h.
12i.
12.j.
12k.
122.
lZ/?l.
12%.
120.
12p.
12q.
12r.
12s.
Composite ice chart for 13 March 1977.
66
Composite ice chart for 20 March 1977.
68
Composite ice chart for 27 March 1977.
70
Composite ice chart for 3 April 1977.
72
Composite ice chart
fore
10 April 1977.
74
Composite ice chart for 17 April 1977.
76
Composite ice chart for 24 April 1977.
78
NOAA-5 VHRR-IR image for 9 January 1977.
80
NOAA-5 VHRR-IR image for 13 January 1977.
81
GOES VISSR (visible) image for lb January 1977.
a2
GOES VISSR (visible) image for 18 January 1977.
a2
GOES VISSR (visible) image for 25 January 1977.
83
NOAA-5 VHRR (visible) image for 1 February 1977.
a4
NOAA-5 VHRR (visible) image for 7 February 1977.
85
NOAA-5 VHRR (visible) image for 10 February 1977.
86
GOES VISSR (visible) image for 22 February 1977.
a7
NOAA-5 VHRR (visible) image for 1 March 1977.
88
GOES VISSR (visible) image for 7 March 1977.
89
NOAA-5 VHRR (visible) image for 8 March 1977.
90
NOAA-5 VHRR (visible) image for 21 March 1977.
91
GOES VISSR (visible) image for 25 March 1977.
92
GOES VISSR (visible) image for
6
April 1977.
92
NOAA-5 VHRR (visible) image for 9 April 1977.
93
NOAA-5 VHRR (visible) image for 14 April 1977.
94
NOAA-5 VHRR (visible) image for 22 April 1977.
95
NOAA-5 VHRR (visible) image for 25 April 1977.
96
vii
12t.
12u.
12v.
12w.
12.X.
12lJ.
122.
12aa.
12bb.
12CC.
12dd.
12ee.
Wf.
1299.
12hh.
12ii.
12jj.
12kk.
1212.
12mm.
12nn.
1200.
12PP.
wq*
12PP.
NOAA-5 VHRR-IR (nighttime) image for 13 December 1976.
NOAA-5
VRRR-IR
(daytime) image for 11 January 1977.
GOES VISSR (visible) image for 21 January 1977.
GOES VISSR (visible) image for 27 January 1977.
GOES VISSR (visible) image for 16 February 1977.
NOAA-5 VHRR (visible) image for 16 March 1977.
NOAA-5 VHRR (visible) image for 22 March 1977.
NOAA-5 VHRR-IR (nighttime) image for
8 December 1976.
NOAA-5 VHRR-IR image for 7 January 1977.
97
98
99
99
100
101
102
103
104
GOES VISSR
(visible)
image
for
9 February 1977.
105
GOES VISSR
(visible)
image
for
10 February 1977.
105
GOES VISSR
(visible)
image
for
15 February 1977.
106
GOES VISSR (visible) image for 28 February 1977.
106
GOES VISSR (visible) image for 17 March 1977.
107
NOAA VHRR (visible) image for 24 March 1977.
108
GOES VISSR (visible) image for 29 March 1977.
109
GOES VISSR (visible) image for 3 April 1977.
109
GOES VISSR (visible) image for 8 April 1977.
110
NOAA VHRR (visible) image for 11 March 1977.
111
GOES VISSR (visible) image for 27 December 1977.
112
GOES VISSR (visible) image for 9 January 1977.
112
GOES VISSR (visible) image for 7 February 1977.
113
GOES VISSR (visible) image for 21 February 1977.
113
GOES VISSR (visible) image for 1 March 1977.
114
GOES VISSR (visible) image for 2 March 1977.
114
viii

12ss.
12tt.
12uu.
12vv.
12ww.
12XX.
12YY.
1222.
12&m.
12bbb.
13.
GOES VISSR (visible) image for 8 March 1977.
115
GOES VISSR (visible) image for 9 March 1977.
115
GOES VISSR (visible) image for 19 March 1977.
116
GOES VISSR (visible) image for 21 March 1977.
116
GOES VISSR (visible) image for 24 March 1977.
117
GOES VISSR (visible) image for 25 March 1977.
117
GOES VISSR (visible) image for 27 March 1977.
118
GOES VISSR (visible) image for 30 March 1977.
118
GOES VISSR (visible) image for 9 April 1977.
119
GOES VISSR (visible) image for 17 April 1977.
119
U.S. Coast Guard icebreaker
Westwind.
133
ix

TABLES
1.
Mean date of first freezing degree-day occurrence.
2.
Maximum freezing degree-day values.
3.
The 20 coldest winters on the Great Lakes, 1777-1977.
4.
Heat storage factor at month's end.
5.
Comparison of dates when ice cover for 1976-77 was
similar in configuration to normal ice cover for
early winter, mid-winter, maximum ice extent, and
early decay winter periods.
6.
Comparison of maximum percent ice extent on the Great
Lakes:
1976-77 and previous winters.
7.
Percentage of possible sunshine at Detroit,
Mich.
x
Page
17
24
31
37
130
131
137

SUMMARY OF GREAT LAKES WEATHER AND ICE CONDITIONS, WINTER
1976-77X
The winter of 1976-77 was the fifth coldest in the past 200
years.
Record-breaking low temperatures from mid-October to
mid-
February, associated with an upper air pressure pattern consisting
of a strong ridge in the westerly flow over North America, resulted
in extraordinary ice cover on the Great Lakes.
Ice was produced
almost simultaneously in various shallow protected areas of the
Great Lakes in early December.
The progression of early winter,
mid-winter,
and maximum ice extent was from 4 to 5 weeks earlier
than normal.
At the time of maximum ice
extent
in early February,
Lake Superior was approximately 83 percent ice covered, Lake Michi-
gan over 90 percent, Lake Huron approximately 89 percent, Lake Erie
100 percent, and Lake Ontario approximately 38 percent.
Spring
breakup started in late February in the southern part of the Great
Lakes region and in early March in the northern part.
The bulk of
the ice cover was gone by the fourth week of April. Shipping was
severely hampered by the abnormally large amount and duration of
the ice cover.
Direct icebreaker assistance by the U.S. Coast
Guard was up about 55 percent over the previous winter season.
1.
INTRODUCTION
F. H. Quinn and R. A. Assel
This report on the 1976-77 winter weather and ice conditions is the
first coordinated report to combine the activities of each of the NOAA
components responsible for monitoring Great Lakes ice conditions.
The
participating units are the National Weather Service
(NWS),
the Environ-
mental Research Laboratories (ERL),
and the National Environmental
Satellite Service (
NESS
).
Individual publications produced in the past
by each of the above units led to an undesirable fragmentation of Great
Lakes ice information. R. A. Assel and F. H. Quinn edited the report
and all authors reviewed it.
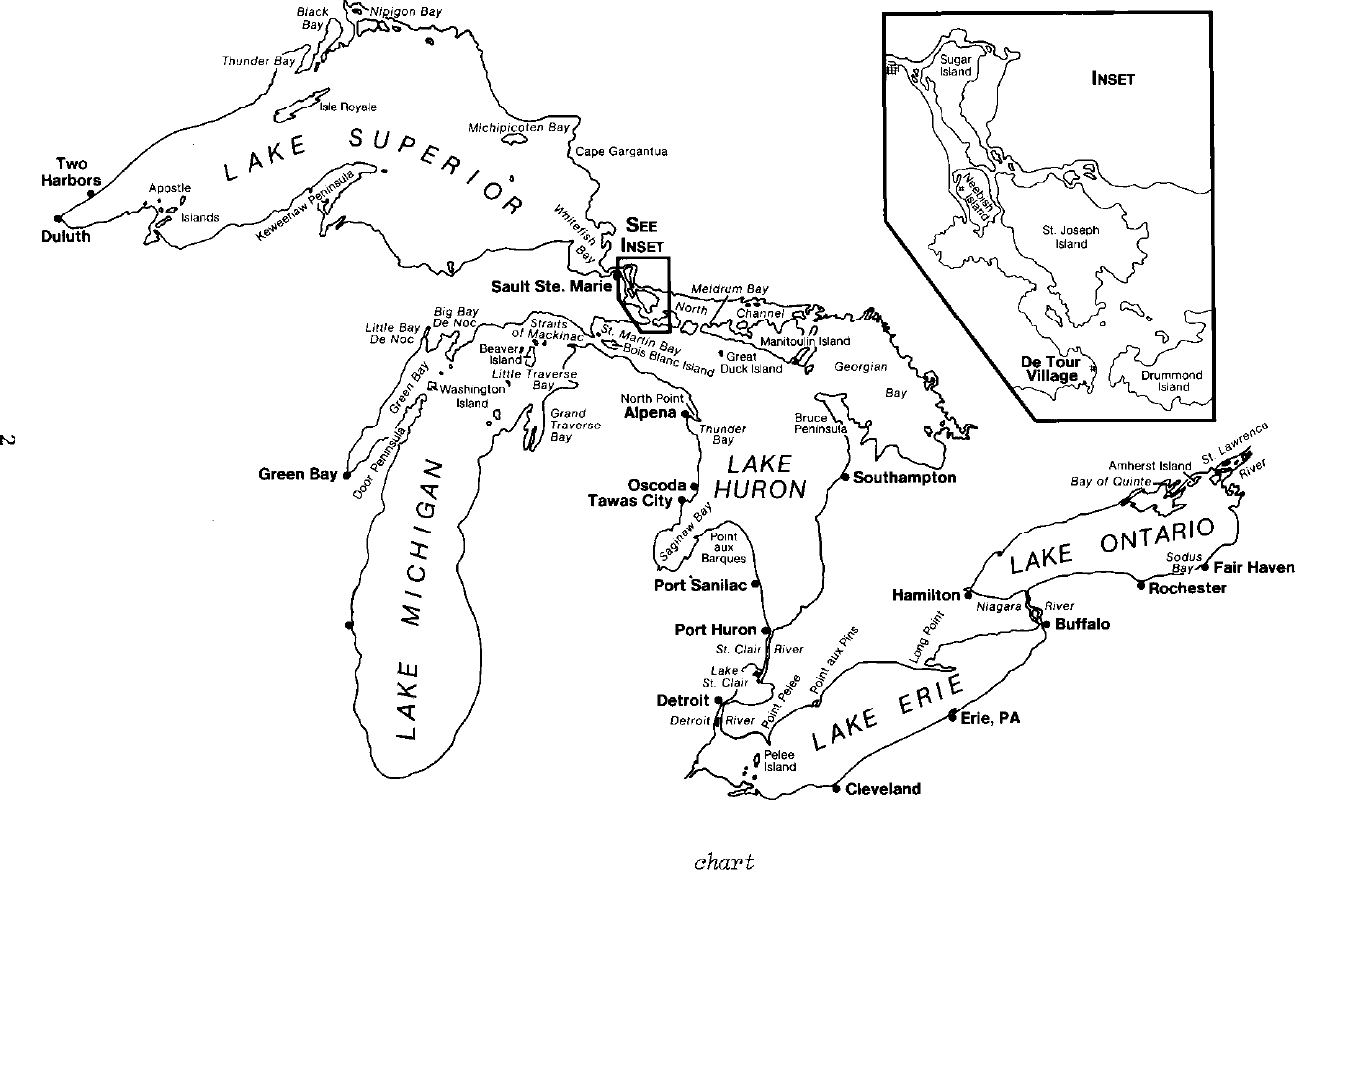
Most geographic locations referenced in this report are shown in
Figure 1.
The winter of 1976-77 is an appropriate year to begin the
combined NOAA ice reports as it was the fifth coldest winter in the
Great Lakes in the past 200 years and the coldest since the program to
extend winter navigation on the Great Lakes began in 1971.
Thus, it
will likely serve as the benchmark winter for Great Lakes ice studies
for many years to come.
*GLERL Contribution No. 138.
N
Milwaukee
ST
u
?
T
4
Figure 1.
Geographic location
chart
for the Great Lakes.
L.,-
-~~I---,_-_,~-__.--.,-._-“-_-.--__
---l--.-__ll,.,-
-

The first ice began to form in the Great Lakes in early December.
With the continued record cold winter, the ice cover grew rapidly,
reaching its maximum extent during the first week of February.
At this
time the percent of ice cover on each of the lakes was as follows:
Lake
Superior, 83 percent; Lake Michigan, 90 percent; Lake Huron, 89 percent;
Lake St.
Clair,
100 percent; Lake Erie,
100 percent; Lake Ontario, 38
percent.
The spring breakup started early in March with the last ice
being seen in Buffalo Harbor on 30 April. The harshness of the 1976-77
winter ice conditions severely hampered waterborne commerce throughout
the Great Lakes.
2.
SUMMARY
OF METEOROLOGICAL CONDITIONS
C. R. Snider
2.1 Synoptic Study of the Winter
The winter of 1976-77 was the coldest on the Great Lakes since
serious attempts at winter navigation began. Record breaking cold
weather persisted over the eastern half of North America from
mid-
October through mid-February.
The meteorological phenomenon responsible for this anomaly was not
confined only to the Great Lakes, but was part of a world-wide pattern.
Excessively warm weather occurred during the same period on the west
coast of North America and in portions of western Europe; the drought
over the western states intensified.
The persistent cold was associated with an upper air pressure
pattern consisting of a strong ridge in the westerly wind flow that
settled over western North America and remained nearly stationary from
late autumn to late winter.
Figures
Za-c
show the mean height of the
700 millibar surface during November and December 1976 and January 1977.
Streamlines coming from the north and northwest directed one frigid air
mass after another across the Great Lakes.
Figures
3a-c
show the normal
mean height of the 700 millibar surface during the same time.
In a
typical winter,
streamlines at this level fluctuate from northwesterly
to southwesterly, allowing alternate movement of cold and mild air
masses over the Lakes.
The cause of these blocking high-pressure cen-
ters that occasionally develop in the general circulation of the at-
mosphere is not well understood,
though some statistical relationships
useful for forecasting have been derived.
Namias (1969,
1971),
Rogers
(1976b),
and Egger (1977) have pointed out that abnormally warm water in
the eastern North Pacific Ocean is associated with, and sometimes pre-
cedes,
the development of such blocking highs.
Namias (1978) gives a
detailed description of the causes of this abnormal winter.
3

Figure
26
Mean 700 mb heights, November 1976.
4

Figure
Zb.
Mean 700 mb heights, December 1976.
5

Figure
2~.
Mean 700
mb
heights, January 1977.
6

Figure
3a.
~omnd
700 mb heights, November 1976.
7

Figure
3b.
Nomad' 700
mb
heights, December 1976.
8
Figure
32.
Normal 700 mb heights, January 1977.
9

Weather systems at the earth's surface develop and move in response
to the configuration of the upper wind flow.
Divergence and subsidence
in the northern and northeastern portions of the ridge kept skies nearly
clear over the continental polar air mass source region in northwestern
Canada.
Unimpeded terrestrial radiation continuously cooled the sur-
face, which in turn cooled the air near the surface in this snow-covered
region.
This cooling in combination with the subsidence aloft brought
about repeated anticyclogenesis.
As each newly generated high cell
built to a critical pressure,
it broke out of the source region and,
steered by the winds aloft,
moved across eastern North America.
The winter of 1976-77 can be divided into several phases:
1.
The preparatory phase, from August to mid-October,
2.
The onset, from mid-October to November,
3.
The northern
intenstive
phase,
from December to early January,
4.
The core of the winter,
or the southern intensive phase,
mid-
January.
5.
The receding phase, from late January to March.
2.1.1 The Preparatory Phase
The roots of the winter can be traced back as far as August 1976.
That was the first of a continuous series of months with below normal
temperatures over the Great Lakes.
Each month from August 1976 through
January 1977 had a mean temperature farther below normal than that of
the previous month.
The anomaly was at first almost imperceptible.
The
normal cool air masses of late summer were simply a little more persis-
tent than the normal warm air masses.
The coolness became a little more
noticeable in September and early October.
2.1.2 The Onset of Winter
A cold front swept through the Lakes region during 15 and 16 Octo-
ber.
The continental polar air mass that followed was not exceptionally
cold for that time of year,
but it established a pattern that was to
persist for 4 months.
No warm front would appear to bring any other
type of air mass over the Lakes until mid-February.
By late November it
had become obvious that an unusually cold winter was in progress. Water
temperatures were near freezing throughout the Lakes, and ice was appear-
ing in some areas from 3 to 4 weeks earlier than normal.
The relatively warm waters of the Great Lakes, even when they are
ice covered, provide a substantial source of heat to modify cold winter-
time air masses. Cold air moving over the lakes is warmed and its
pressure lowered. For this reason, the center of highest pressure
10

rarely passes directly over the Lakes.
Usually about half of them will
go to the north and half to the south.
The northerly jet stream of fall
1976 directed most of them well to the south, bringing rather low
tern
peratures to the entire region and the greatest negative departures from
normal to the southern part of the region (see Figs.
4a-c).
2.1.3 The Northern Intense Phase
During December and early January the ridge over western North
America flattened a little, but remained firmly anchored in place.
Cold
high centers were then directed through the slot between the Great Lakes
and Hudson Bay.
This section of Canada suffered extreme cold during
this phase.
North of the Lakes December monthly means were lower than
those in January,
a rare occurrence. Cold air masses also persisted
throughout this period over and south of the Lakes, but they were only a
sample of what was yet to come.
Figure
4~.
Mean temperature
(“Cl,
November 1976.
11

4
Figure 4b.
Mean temperature departure from normal ("Cl,
mxmnber
1976.
Figure
4~.
Mean temperature departure from
normal
la),
November 1976.
12

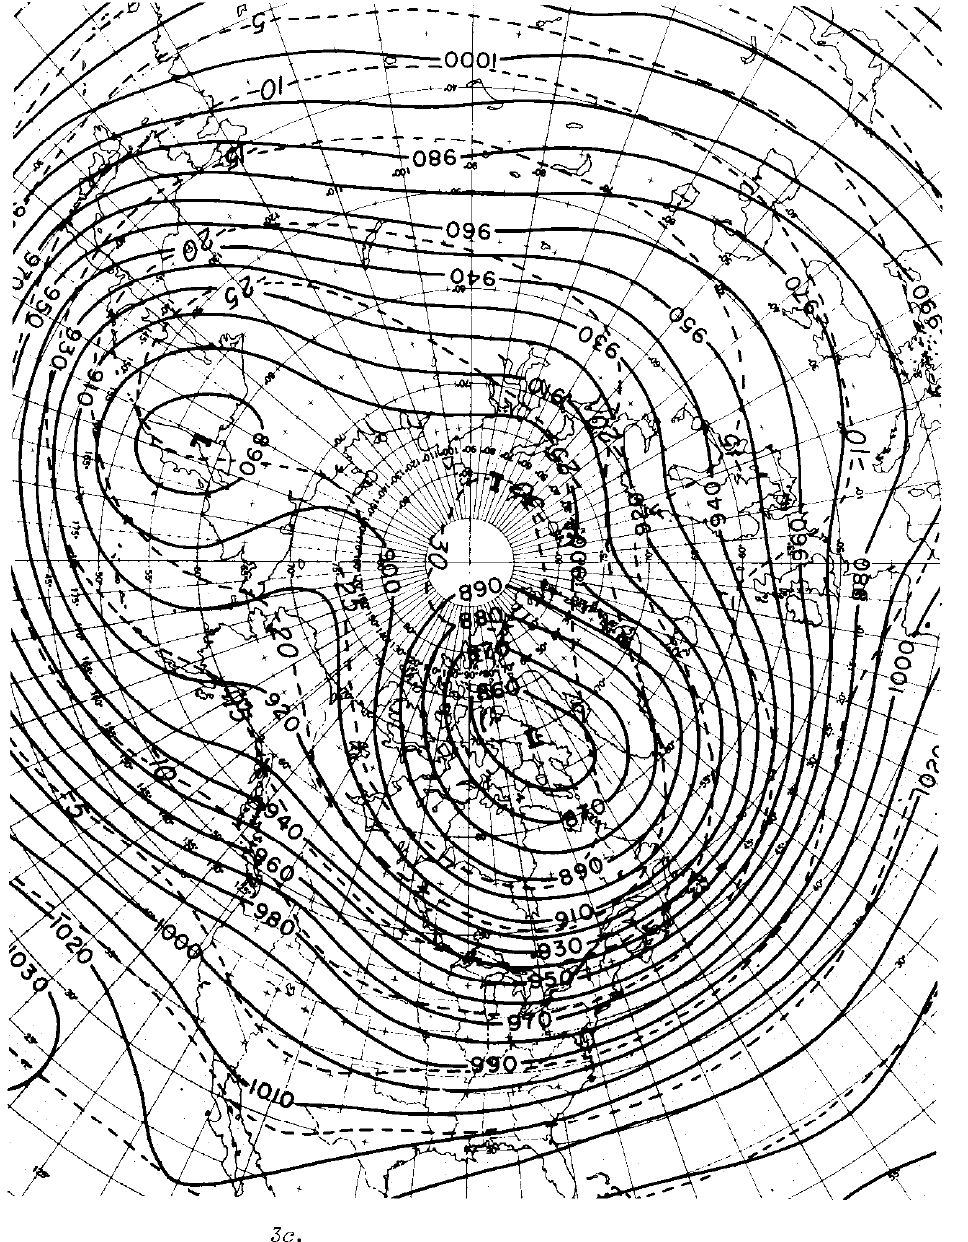
2.1.4 The Core of the Winter
In early January the Arctic stratosphere underwent a major warming,
perhaps fueled by southerly winds from the eastern Pacific.
This pro-
duced a deep anticyclone centered near the North Pole, (Fig.
2~)
which
absorbed the shallower anticyclones normally present
over
the northern
portions of Asia and North America.
Masses of cold air poured directly
from the Arctic into the heart of the continent.
The first cold wave of this intense phase spread across the Great
Lakes on 8 January.
On the morning of 9 January the highest pressure
was just south of Duluth,
Minn.,
and most stations in the northern Lakes
region reported their lowest temperatures of the winter (Fig.
5~).
Figure
5a.
Minimwn
temperature, 9
Jcmuary
1977
("Ci.
13
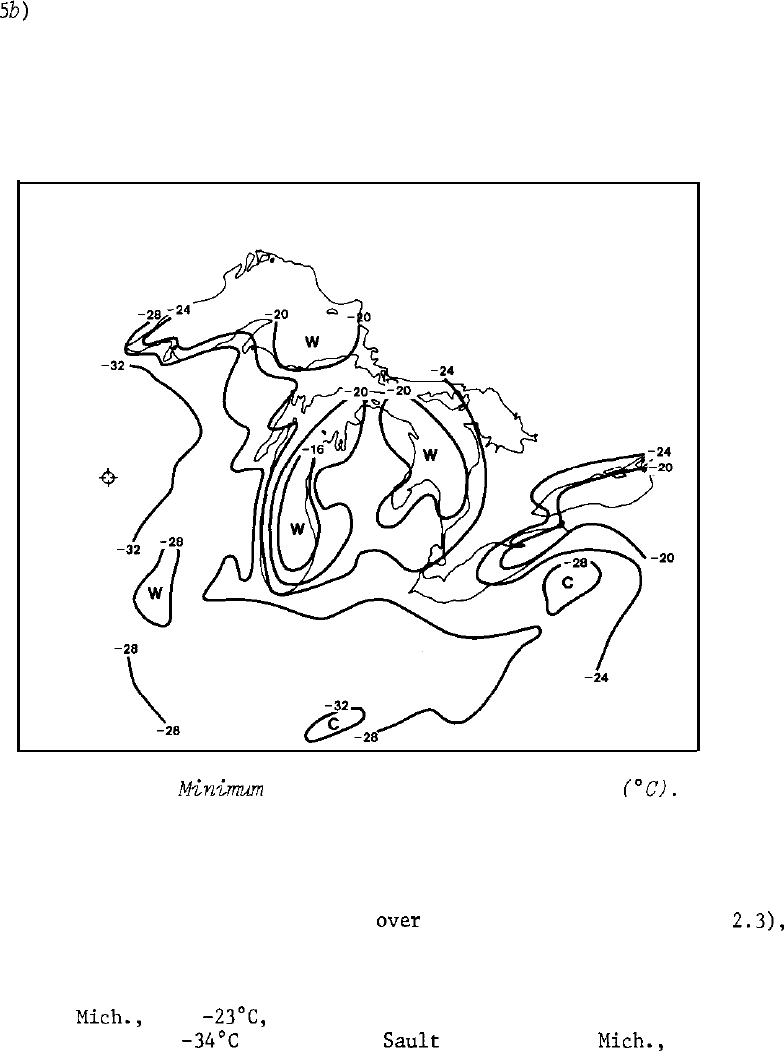
An even colder air mass swept southward during 15 and 16 January.
The center moved through the Plains States,
sparing the Great Lakes its
greatest cold, but bringing the lowest temperatures of the winter to
cities along the southern Lakes and to most of the country farther south
(Fig.
5b)
on the morning of 17 January.
Figure 5b.
Minim
temperature, 17 January 1977
("Cl.
The great temperature anomalies
over
the Great Lakes (Section
2.3),
and the massive ice cover that resulted, were due not so much to ex-
tremely low individual temperature readings as to the long continuance
of well below normal temperatures. The lowest temperature of the winter
at Detroit,
Mich.,
was
-23"C,
not as cold as is experienced in many
milder winters.
The
-34'C
extreme at
Salt
Ste. Marie,
Mich.,
was only
a little more unusual.
14

2.1.5 The Receding Phase
Warmer air masses began pushing intermittently into the Lakes
region in mid-February.
Temperatures averaged near normal during the
last half of February and March.
But normal temperatures were still
below freezing during much of this period,
so that with the exception of
portions of the southern Great Lakes the massive ice cover already
preseni
continued to thicken slowly.
A few warm days during March
started the melting, which proceeded at a more rapid than usual rate
during the warm month of April.
Shallow waters cleared rapidly, but
many ice formations on deeper water were so thick that it was well into
May before the last vestige was gone.
2.1.6 The Precipitation Pattern
Each of the cold air masses that burst across the Lakes was pre-
ceded by a rather weak cold front, weak because the air mass ahead of it
was only slightly warmer than the air mass following it. These weak
fronts can produce only small amounts of precipitation. Average snow-
fall over the Great Lakes Basin was considerably less than normal, with
the spectacular exception of a few localities on the lee shores. Much
publicity was given the heavy snowfall that paralyzed Buffalo, N.Y.
Similar heavy snow fell locally at Watertown, N.Y., and at Sault
Ste.
Marie (Fig. 6).
2.2 Freezing Degree-Days
The concept of freezing degree-day
(FDD)
accumulations is useful in
forecasting a wide range of phenomena:
the usage of heating fuel, the
mat‘uration
of crops, etc.
The growth of fresh water ice is closely
correlated with the accumulation of FDD's (Richards, 1963; Snider, 1974;
Assel, 1976).
FDD calculations are sensitive to minor changes in computational
procedures.
Various workers have used different methods of computing
daily mean temperature, negative FDD's (thawing degree-days), and
determination of the beginning of the freezing season. Data presented
here were derived as described below.
A.
Thawing degree-days (defined as positive departures of mean
daily air temperatures from
O°C)
are subtracted from the FDD
total.
It is possible for the accumulated FDD total
to
fall
below zero owing to an extended mild spell.
If this happens,
FDD's and thawing degree-days continue to be added or sub-
tracted algebraically.
15

Figure 6.
~ecipitation
excess
or
deficiency
ian
water equivalent),
December 1976 through
February
1977.
B.
A determination must be
made
as to when to begin the FDD
tabulations in the fall.
The method used at NWS, Detroit,
begins the tally on the first fall date on which one or
mre
FDD's
occur (a mean temperature of -1°C or below).
If this
occurs before the mean (or normal) date of the first occur-
rence (Table
l),
an algebraic summation process is initiated
and continued up through that mean date, which is based on
normals currently being used. If on this mean date the
accumulated total is negative, the total is dropped and the
FDD tally will begin on the first date after this mean date
that a -1°C or lower mean daily temperature occurs.
If the
total is positive, the summation process continues to build
upon this total for the remainder of the winter.
Of course,
if no
FDD's
occur before this mean (normal) date, the tally is
routinely initiated on the first day thereafter with an FDD
occurrence.
16

Tab&
1.
Mean Date of First Freezing
Degree-Day Occurrence
Location
Date
Duluth, Minn.
9 Nov.
Marquette,
Mich.
19 Nov.
Salt
Ste. Marie,
Mich.
24 Nov.
Green Bay, Wis.
23 Nov.
Milwaukee, Wis.
27 Nov.
Muskegon,
Mich.
29 Nov.
Alpena,
Mich.
27 Nov.
Detroit,
Mich.
29 Nov.
Toledo, Ohio
29 Nov.
Cleveland, Ohio
10 Dec.
Buffalo, New York
1 Dec.
Rochester, New York
1 Dec.
17

Figures
7a-j
show normal FDD curves (solid line) and curves
representing winter 1976-77 (dashed line) at several Great Lakes cities.
The
most
pertinent data from the NWS and the Great Lakes Environmental
Research Laboratory
(GLERL)
are summarized in Table 2.
The accumulation
of
FDD's
during winter 1976-77 was everywhere greater than normal, with
the excess above normal being greatest in the southern part of the Great
Lakes region. At Cleveland, Ohio, the accumulation reached 330 percent
of normal.
The maximum was reached considerably earlier than normal
everywhere except at
Salt
Ste. Marie.
Temperatures during the breakup
season were above normal except in the northeastern part of the region,
where the onset of spring was retarded by the ice cover itself.
F
c
3600
2ooc
c
2
8
$
2700
15oc
El
8
F
‘R
&a
1800
IOOC
F
IA
F
;i;
5
E
a
900 SIC
s
c-~
i
~+L
._-s-T-mr~
5 10 15
20 25 30
5 10
15
20 25
3
NOV. DEC.
1
11
1
1 1
I
1
5
10 15
20
25
30
5
10 15
20
25 5
10 15
20
25
30
5
10 15
20
25
JAN.
FEB.
MAR.
APR.
Figure
7a.
Freezing degree-day accumulations,
Duluth,
Minn.
18

Figure 7b. Freezing degree-day accumulations, Marquette,
Mich.
%
!
A
0
2
2700
,500-
~~~--
&
2
F
‘6
0
,800
looo-~
-
~~
-.L
~-~~
E
P
;;I
5
E
~
~__~
~~~
5
Y
0
1,
1
1,
1
1
1
I,
1
5
10
15
20
25
30
5
10
15
20 25 30
5
10
15
20
25 30
5 10
15
20
25
5
10
15
20
25
30
5
10
15
20 25 30
NOV.
DEC. JAN.
FEB.
MAR. APR.
Figure
7~.
Freezing degree-day accumulations,
Sault
St. Marie,
Mich.
19

F
c
F
c
3600
2000
3600 2000
I
I
55
1515
2020 2525 3030
55 1515
2020 2525 3030
55 1010
1515
20
25
20
25
30
5
10
30
5
10
1515
2020 2525
5
105
10
15
20
25 30 515
20
25 30 5
1515
20
:
20
:
NOV.NOV.
DEC.DEC.
JAN.JAN.
FEB.FEB.
MAR.MAR.
APR.APR.
F
c
3600
mot
2
I2
b
2700
15x
E
F
0
Figure 7d.
Freezing degree-day
accwmlations,
Green Bay, Wis.
P
‘4
8
‘8oo
‘ooc
u’
D
d
2
E’
a
900
50
s
oL
-...~~---‘------...-----
I
--..
.
--..,
*-.*
+
*._
I,
1,11,1
:
5 10 15
20 25 30
5
10 15
20 25 30
5
10 15
20 25 30
5
10 15
20 25
5
m 15
20
25 30
5
15
20 25
Figure
7e.
Freezing degree-day
accmuZations,
Milwaukee, Wis.
20

F
c
3600
2000
I
x
k
,
2
I
a
1
.E
.^^^
.^^^
I
&:
,t?“”
I”“”
;
B
/
~~~~~
!
%
7
c
5
900
500
~~~
__
~~~
~~~~-~
::
4
I
0 5
10
15
20 25
30
5 10
15
20
25
30
5
10
15
20
25
30
5
10
15
20
25
5
10 15
20
25 30
5 10
15
20 25
30
NOV.
DEC.
JAN.
FEB.
MAR. APR.
Figure 7f.
Freezing degree-day accumulations, Muskegon,
Mich.
Figure 7g.
Freezing degree-day accumulations,
Alpena,
Mich.

F
c
3600
2001
r
2
a
Q
2100
150,
&I
2
F
‘ij
%
‘8oo
‘ooL
It
$
;;;
5
E
a
900
5oc
2
~~~-t-p~~~~~p~~
.~~~~~
/
~~~~~.
:
~
,-
/‘---
/----
-w__.
I
i
1,1/+*’
L-
*-
----j
.-__..
1
_C----.
5
10
15
20 25 30 5
10
1,
I
u
*.--
/
I
‘-.*
‘x.
m
m
_---- ,
-.
1,,
1,
I,,
I1
1,,
1
5
20 25
30
5
10 15
20 25
30
5 10 15
20 25
5
10 15
20 25
30
5
10 15
20 25
Figure 7h.
Freezing degree-day accumulations,
CZeveland,
Ohio.
10 15
20 25
30
5 10 15
20 25 30
5
10 15
20 25
30
5 10 15
20 25
5
10 15
20 25
30
5 10 15
20
25
:
NOV.
DEC.
JAN.
FEB.
MAR. APR.
Figure
7i.
Freezing degree-day
accmulations,
Buffalo,
N.Y.
22

f
k
1
1
2700
1500
‘E
8
1800 1000
It
E
F
3
z
a
900 500
9
0
5
10 15
20 25 30 5
10 15
20 25 30
NOV.
DEC.
.-,
/&
5
10 15
20
25
3
JAN.
I
I
-;
---
~--
.+-
I
;
j
-~~~~~~,.~-~
,
/,
111
11
1,
II,,
1,,
5
10
15 20 25
5
10 15
20 25 30 5
10
15 20 25
FEB.
MAR. APR.
Figure
7j.
Freezing degree-day
accmlations,
Rochester, N.Y.
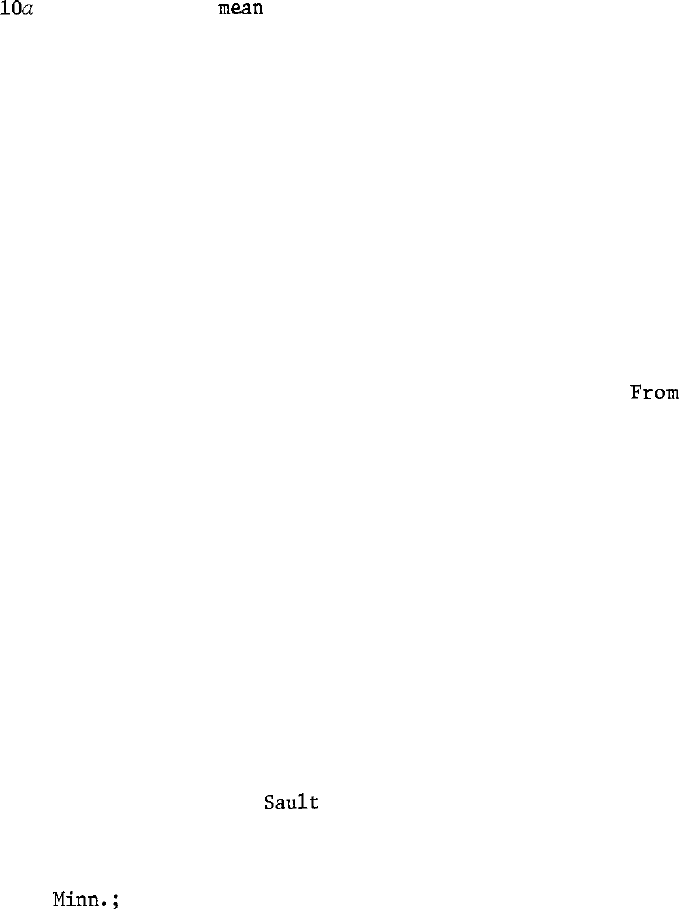
2.3 Climatic Anomalies and Comparisons
Figures
4a,
8a,
and
¶a
show mean temperatures for November and
December 1976 and January 1977. The well-known effect of the Lakes in
warming the lee shores shows up strongly on these charts.
Figures
4b,
8b,
and
9b
show the same data expressed in terms of
degrees Celsius departure from normal.
Even here the lake affect is
quite evident, for the normal variability is much greater inland than
along the lakeshore.
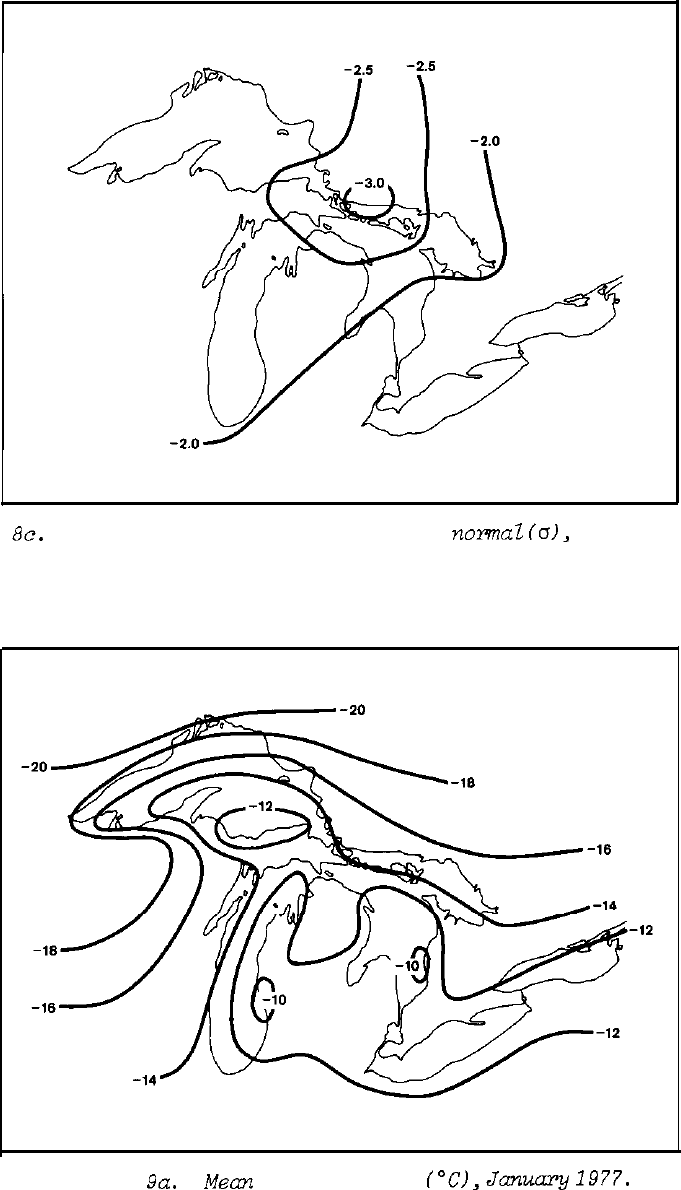
Figures
4c,
8c,
and
9c
show the same data expressed in terms of
standard deviations departure from normal.
This transformation removes
the lake effect and gives
a
realistic 'picture of the anomalous nature of
the cold weather during these 3 months.
A departure more than 3 stan-
dard deviations below normal will occur 13 times in 10,000 occasions.
23

Table 2.
Maxim
Freezing Degree-Day
Values
Normal*
Maximum**
Normal*
Maximum**
maximum
FDD's
("C)
maximum
date 1976-77
Location
FDD's
("C)
1976-77
date
Duluth, Minn.
1267
1453
3
Apr.
7
Mar.
Marquette,
Mich.
756
933
30
Mar.
6
Mar.
Sault
ste.
Marie,
Mich.
946 1246
3 Apr.
9 Apr.
Green Bay, Wis.
787
1157
27 Mar.
3 Mar.
Milwaukee, Wis.
489
852
17 Mar.
2 Mar.
Muskegon,
Mich.
329
673
17 Mar.
2 Mar.
Alpena,
Mich.
647 904
29 Mar.
3 Mar.
Cleveland, Ohio 191
631
1 Mar. 21 Feb.
Buffalo, N.
Y.
272
Rochester,
N.
Y.
326
*From
GLEIU
records.
594
18 Mar.
23
Feb.
527
18
Mar.
23
Feb.
**From NWS, Detroit, records.
24

Figure
8~.
Mean temperature
("Cl,
December 1976.
Figure 8b. Mean temperature departure from
nomal
("Cl, December 1976
25
I
Figure
8~.
Mean temperature departure from
normal
lo),
December 1976.
Figure
9a.
Mem
temperature
("CI,
JGWLU'Y
1377.
26

Figure
9b.
Mean temperature departure
from
normal
("C/,
January 1977.
Figure Se.
Mean temperature departure
fmmi
nomaZ
(G),
Jmuary
1977.
27
Such departures did occur on the northern shore of Lake Huron in Decem-
ber 1976 and over the southern end of Lake Michigan and a broad area to
the south in January 1977.
Figures
lOa
and
b
show the
mean
temperature and the departure from
normal for the entire 3-month period. The mean trajectory of the cold
air masses to the west and south of the Lakes is well illustrated, as is
the effect of the Lakes on air temperature.
2.4 Comparison with Previous Winters
As most of the extraction of sensible and latent heat from the
water occurs during November,
the date of initial ice formation is well
correlated with the November mean air temperature.
Ice forms and
thickens during December and January and reaches its greatest mass
during February.
The date of the final melting, usually in April, is
well correlated with the February mean air temperature.
The rate of
melting during March and April is not as well correlated with ambient
air temperatures as one might expect.
Apparently absorption of solar
radiation plays as important a role in conductive heat transfer.
Fr0m
the above statements,
it can be concluded that the mean temperature of
the 4-month period from November through February is a satisfactory
indicator of the severity of a winter season.
Most of the major meteorological observatories in the region have
instrumental records about 100 years in length.
All of them have been
relocated at least once, and none of the records are completely homo-
geneous.
Changes in observational and computational procedures require
that early records be carefully studied and adjusted if necessary before
comparing them with modern records.
Unofficial observations can extend
the record back many more years in a few places, but these observations
must be used with even more care.
Noninstrumental observations can also
be used to indicate the severity of a winter. The ice cover itself is
an excellent integrator of mean winter temperatures over broad areas.
The mean temperature of these 4 months is averaged over four
widely separated stations, Duluth,
Sault
Ste. Marie, Detroit, and
Buffalo, to obtain a single index of winter severity on the Great Lakes.
High quality data from these four stations are available back to 1888.
There is nearly continuous data of somewhat lesser quality back to 1820
for Minneapolis,
Minn.;
Detroit; and Albany, N. Y. These were nor-
malized to the same base.
For earlier data the nearest continuous
record is from New Haven, Conn., which goes back to 1780.
These records
were also normalized to the same base,
but were used very cautiously.
Their indications were compared to the continuous ice record back to
1807 at Buffalo,
to temperature records at Detroit between 1781 and
1786, and to various narrative weather summaries from the Great Lakes,
mostly around Lake Erie.
28

Figure 1 Oa.
Mean Temperature (“Cl, November 1976 through January 1977.
Figure
1
Ob.
Mean temperature departure
from
nomad
(“Ci,
November 1976 through January 1977.
29

It was thus possible to classify as severe, ordinary, or mild the
200 winters from 1777 through 1977 over the Great Lakes, and to list in
order of severity the 20 (first
decile)
coldest of the two centuries.
This listing is given in Table 3 and each of the winters that proved to
be colder than 1976-77 is discussed briefly.
2.4.1 The Winter of 1903-04
November, December, and January of this winter each averaged just a
little warmer than the corresponding months of 1976-77. February of
1904 was much colder than February 1977 (-10.9 vs.
-3.7OC).
Ice formed
a little later than in 1976-77, but continued to thicken rapidly through
February.
Navigation out of Cleveland was not possible before 1 April,
the Soo Locks opened 30 April,
and Duluth Harbor opened 8 May.
There
had been no attempt to extend the previous navigation season and closing
dates were normal for that era.
2.4.2 The Winter of 1783-84
November and the first part of December were mild. The last 11
days of December were continuously below freezing at Detroit. After a
brief thaw the first few days of January,
very cold weather set in for
the rest of the month.
The Detroit River froze over on 7 January.
The
temperature at Detroit was -27 or
-28'C
each morning from 27 through 30
January.
Another brief thaw the first of February was again followed by
cold weather, which continued into March. On 6 March the ice on Lake
St.
Clair
was 3-feet thick. On 22 March the river could still be
crossed by sledge.
2.4.3 The Winter of 1874-75
This winter was quite similar to that of 1903-04. November and
January were a little warmer
than
in 1976-77; December considerably
warmer.
February was extremely cold,
-11.4"C.
As might be expected,
this sequence of weather events had a major effect on the springtime
opening of navigation.
The 12 May opening of the Soo Locks was the
latest date in the 121 years the facility has been operating.
2.4.4 The Winter of 1779-80
It may seem presumptuous to give a temperature value for this
winter,
and especially to categorize it as colder than any of the others
discussed, as there was not a single thermometer in the Great Lakes
region at the time.
Nevertheless,
the evidence seems overwhelming. All
the weather diarists in New England (and there were many) agreed that
this was one of the two coldest winters of the eighteenth century.
(The
other was 1739-40).
Diarists in Detroit agreed it was the coldest they
had experienced at that location.
(None of them had been there prior to
1760.) Only
January
and February 1780 temperatures are available
for
30

Table
3.
The 20 Coldest Winters on the Great Lakes, 1777-1977
Rank Winter
Nov.-Feb.
Nov.-Jan.
mean temp.
("C)
mean temp. ("C)
Character
1
1779-80
-9
2
1874-75
-9
3
1783-84
-8
4
1903-04
-7.9
5
197677 -7.7
6
1872-73
-7.5*
7
1831-32
-7.5"
8
1855-56
-7.5"
9
1919-20
-7.4
10
1880-81
-7.3
11
1917-18
-7.2
12
1820-Z -7
13
1856-57
-7
14
1822-23
-7
15
1892-93
-6.8
16
1962-63
-6.5
17
1791-92
-6.5"
18
1835-36
-6.5"
19
1817-18
-6.5*
20
1796-97
-6
-10
E
-6.5"
L
-6.5*
L
-6.2
L
-8.2
E
-7.5"
-6.5*
-6
-7.0
-7.2
-6.8
L
-7
-7
-4.5"
L
-5.8
L
-6.3
L
-6
L
-5.5x
L
-5
L
-7
E
Each of the 20 coldest winters was characterized as early
(E),
intermediate,
or late
(L),
according to the timing of its coldest period.
*Data prior to 1888 were not of sufficient quality to justify means with
O.lO"C
precision.
They have been rounded off to the nearest
0.5"C.
31

New Haven, and these are not particularly cold.
This can be reconciled
with narrative reports only by assuming extremely low temperatures for
November and December 1779.
A
noninstrumental
record kept at the British Naval Shipyard on the
St. Clair River shows the same general trend.
Extreme cold in November
and December continued through mid-January,
but February was quite mild.
Frost persisted through the afternoons the last week in November.
Ice
was flowing in the St. Clair River on 16 December, and on the following
day the river froze over.
Only light snow was recorded during the very
cold weather through December and early January. Mild periods during
late January and February were accompanied by heavier snow.
A signifi-
cant thaw was noted 21 February.
The first rain was reported 7 March.
Late March and April were cool.
Small boats were first able to cross
Lake St. Clair on 16 April.
The ice bridge above Port Huron,
Mich.,
broke 20 April, and the river was jammed with ice until at least 11 May.
Further east the supply ship from Fort Erie could not get through to
Detroit until 16 May.
2.4.5 Character of Winters
Each of the 20 coldest winters (Table 3) was characterized as late
CL),
intermediate, or early
(E),
according to the timing of its coldest
period.
In 13 of the 20, February was the coldest month; in 4 the cold
weather was rather evenly distributed throughout the season; and in only
3 did the major part of the cold weather come before February.
We conclude that during the last 200 years only four winters are
likely to have produced more massive ice cover on the Great Lakes than
did the winter of 1976-77, and in only one of those winters did the
heavy ice cover appear early enough to have had a more inhibitory
effect on extended season navigation.
3.
SUMMARY OF ICE CONDITIONS
R. A.
Assel,
G. A. Leshkevich, C. R. Snider, and D. Weisnet
3.1 Data Collection Platforms and Processes
Primary sources of ice-cover information used to document the
1976-
77 Great Lakes ice cover include:
visual aerial ice reconnaissance,
side looking airborne radar
(SLAR),
and satellite imagery. A comparison
of SLAR and NOAA-4 and LANDSAT- satellite imagery is given by Leshkevich
(1976).
Ice charts are the end product resulting from interpretation of
this data.
Ice charts depicting ice distribution and concentration, as
well as size and age of floes,
were received
at
GLERL throughout the
winter from the Ice Navigation Center, Cleveland, and Ice Forecasting
32

Central, Ottawa, Ont., Canada.
Interpretations of ice conditions made
from NOAA-5, Very High Resolution Radiometer (VHRR) satellite, and
Geostationary Operational Environmental Satellite (GOES) imagery on a
weekly basis were received from NESS in Washington, D.C.
SLAR imagery
and ice charts based on it were received from the Ice Navigation Center,
Cleveland.
In addition to this primary data, weekly and daily surface
reports of ice conditions and thickness were received from observers for
GLERL and the U.S. Coast Guard.
3.1.1 Visual Aerial Ice Reconnaissance
Trained ice observers for the U.S. Coast Guard and the Canadian
Department of the Environment record visually observed ice conditions on
the Great Lakes periodically during winter.
GLERL
receiv~es
copies of
most of the ice charts produced during a given winter season; during
winter 1976-77, 196 ice charts were received from the U.S. Coast Guard
and 72 ice charts from the Canadian Department of the Environment. In
addition, GLERL produced two ice charts as a result of visual reconnais-
sance flights made over southern Lake Michigan in February.
U.S. Coast Guard aircraft used for visual ice reconnaissance in-
clude the Grumand HU-16 Albatross and smaller fixed wing craft and
rotary (helicopter) aircraft.
Flights are made from Chicago, Ill.;
Detroit,
Mich.;
and Traverse City,
Mich.
A detailed description of the
U.S. Coast Guard 1976-77 visual aerial ice reconnaissance program is
given in the Ninth Coast Guard District, Domestic Icebreaking Plan,
Annex W to Commander Coast Guard District Nine Operation Plan No.
l-(FY)
(1976a).
Canadian aircraft used to support visual aerial ice recon-
naissance include a Douglas DC-3 and a Lockheed Electra
L188C.
For
information on the Canadian 1976-77 visual observation program, see
Noble (1976).
3.1.2 Side Looking Airborne Radar
The National Aeronautics and Space Administration Lewis Research
Center, in cooperation with the U.S.
Coast Guard and NOAA, has developed
a SLAR system for ice surveillance on the Great Lakes. The system,
mounted aboard a HC-130B aircraft operating out of Cleveland, operates
in the X-band at a frequency of 9.245
GHz
(3.245 cm wave length).
Flight altitude for SLAR missions is 3.35
la
(11,000 ft) with an average
ground speed of 280 knots.
Flights are made regularly over all of the
Great Lakes with the exception of Lake Ontario.
The advantage of SLAR
over visual reconnaissance and satellite imagery is its all-weather
capability and ability to "see" through clouds.
A history of the
development of the current system is given by Schertler et
al.
(1975).
The operational plan for U.S.
Coast Guard missions for 1976-77 is given
in the joint United States Coast Guard-Canadian Coast Guard Guide
to
33
Great Lakes Ice Navigation
(1976b).
During winter 1976-77, 82 inter-
preted SLAR images (ice charts) covering 24 missions were received by
GLERL.
Owing to mechanical difficulties with the HC-130B aircraft, no
flights were made during February and most of March.
3.1.3 Satellite Imagery
NOAA-5 and GOES-l satellite imagery were used in ice-cover docu-
mentation. The NOAA-5 satellite represents the third generation of
environmental satellites in the National Operational Environmental
Satellite System. The orbit is near polar and sun synchronous so the
satellite always crosses the equator at the same local solar time, in
this case 0830 and 2030. This orbit is a typical polar orbit, providing
a twice-daily thermal infrared image and a one-time visible band image
of an area.
This type of orbital coverage permits detection of changes at
12-
hour intervals for dynamic snow and ice events. Cloudiness commonly
reduced these observations, but in most of the U.S. it is possible to
secure at least one cloudless view per week.
The primary sensor for
hydrologic use aboard NOAA-5 is the VHRR,
dual channel scanner (visible,
0.6-0.7
urn;
infrared, 10.5-12.5
urn).
NOAA's GOES has demonstrated the value of a
35,000-la
geosynchro-
nous orbit,
in which the satellite appears to hover "motionless" over a
point on the earth.
The advantages of this type of orbit are as fol-
lows:
1.
2.
3.
4.
5.
6.
7.
The viewing station is constant.
Almost
l/6
of the earth may be observed almost synoptically.
Observations may be more frequent, e.g., every 30 minutes.
"Telescopic" observations can be made of those areas where
high resolution is required for detailed observations.
Time-lapse imagery of ice movement, storms, floods, snow
cover, etc., can be prepared to study the genesis and dynamic
aspects of these important hydrologic events.
The satellite can collect and relay data in real time from
instruments located at remote inaccessible sites upon command
24 hours a day. Furthermore,
these readouts can be programmed
to coincide with scheduled detailed imagery, if desired.
Processed data products can be retransmitted from central
processing and analysis centers via satellite to local fore-
cast/warning centers in near real time.
34

The VHRR images of the Great Lakes presented here have been spec-
ially processed to improve their quality and to rectify and correct the
distortions due to earth curvature,
earth rotation, and spacecraft
roll-
attitude errors. This rectification and correction was accomplished by
using an algorithm developed by Legeckis and Pritchard (1976) in which
the digital tape data are rerun and reformatted.
The corrected tape is
then processed through a Digital
Muirhead
Device
(DMD)
to prepare new
images.
Standard NESS
snc~w
and ice enhancement programs were applied to
the tapes to bring out details of the snow and ice areas.
The GOES images were prepared from Visible Spin Scan Radiometer
(VISSR)
negatives stored at NOAA Environmental Data Service
(EDS).
Tapes were not archived for
GOES/VISSR
images.
The GOES images pre-
sented here have not been enhanced or rectified. North-south fore-
shortening is noticeable in images taken in higher latitudes such as
those of the Great Lakes.
3.2 General Description
The ice cycle that occurs on the Great Lakes each winter can be
divided into three phases
(Randy,
1971): a cooling phase, an ice
formation phase, and a breakup or fragmentation phase.
In brief, the
cooling phase starts in fall as air temperatures drop below water
temperatures and the water begins to lose heat.
Ice formation starts
after fall overturn is completed and a stable water density gradient
enables rapid cooling to take place in the surface layer. During the
ice formation phase, both stable and dynamic ice is formed. Even though
the net energy balance of the lake is negative during this time, i.e.,
the water mass is losing heat, rapid and extensive changes in ice extent
and thickness can occur due to wind and current induced ice movement,
upwelling of warmer waters, and even mid-winter thaws on some portions
of the Great Lakes. The breakup period begins when the energy balance
of the ice cover becomes positive and may be well defined and short if a
warming trend starts and is persistent,
or it my drag on as cold and
warm periods alternate in frequency and intensity in spring. In this
report the end of the ice formation period is defined as the date the
running sum of
FDD
accumulations at representative stations for each
lake reaches its maximum value.
3.2.1 Fall Cooling Phase
As an indication of the intensity of the fall cooling phase the NWS
Forecast Office at Detroit has developed an index of antecedent heat
content of lake waters. This index is based upon the following three
types of water temperature data available on the Great Lakes:
1.
Surface temperature, measured by satellite-borne infrared
sensors.
2.
Near-surface temperatures measured at municipal and ship water
intakes.
35

3.
Occasional expendable
bathythermograph
soundings from Lake
Superior.
Each of these observational tools provides data useful in
some
phase of the ice forecasting program.
However, indirect methods must
still be used to approximate the heat content of the lake as prediction
of heat content based on models is still in the developmental stage.
Each lake goes through an isothermal stage twice each year, usually
in April or early May, and again in early December. At these times the
lake is isothermal at precisely 4°C.
The heat content associated with
this temperature may be taken as the base heat content of the lake.
Any excess or deficiency above or below this base heat content has
been absorbed from or lost to the atmosphere since the last isothermal
stage.
Average air temperatures, integrated over periods of several
months, have been found to give useful indications of the water's heat
content.
Several different methods of integrating air temperature have been
used.
The
most
useful attempted so far,
incorporating a "decay factor"
to give greater weight to more recent data, is calculated as follows:
s =
ATm
+
s,-1
,
m
2
where
S
is the heat storage factor at the end of a month,
m
AT
is the departure from normal of the average air temperature
m
for the month,
S
m-l is the heat storage factor at the end of the previous month.
The physical meaning of the heat storage factor cannot be precisely
defined.
It approximates the excess heat, sensible and latent, or a
unit water mass within the
epilimnion.
Units are degrees farenheit.
At the end of August 1976, the heat storage factor was still
positive over
most
of the upper lakes despite below normal air temper-
atures everywhere except over Lake Superior.
By the end of September,
positive factors were present only over small portions of the upper
lakes, and increasingly negative heat storage was indicated everywhere
else.
This was the first significant harbinger of an early freezeup.
By the end of October, large negative heat storage factors were apparent
throughout the Lakes; they continued to increase through January.
Table
4 summarizes the changes in the heat storage factor during the cooling
and freezing period of 1976-77.
36

Table 4.
Heat Storage Factor at Month's End
City
Aug.
Sept. Oct. NOV.
Dec.
Jan.
Duluth, Minn.
+1.15
f1.03
-3.59
-4.95
-7.43
-8.06
Green Bay, Wis.
f0.71
-0.25
-3.08
-5.39
-8.60
-10.45
Chicago, Ill.
-0.89
-1.15
-3.97
-5.79
-7.10
-10.52
Sault
Ste. Marie,
Mich.
f1.10
-0.30
-2.60 -4.05 -7.13 -7.51
Detroit,
Mich.
f0.22
-0.64
-3.17
-4.89
-5.95
-8.88
Buffalo,
N.Y.
-0.55
-1.03
-3.12
-4.41
-5.12
-7.53
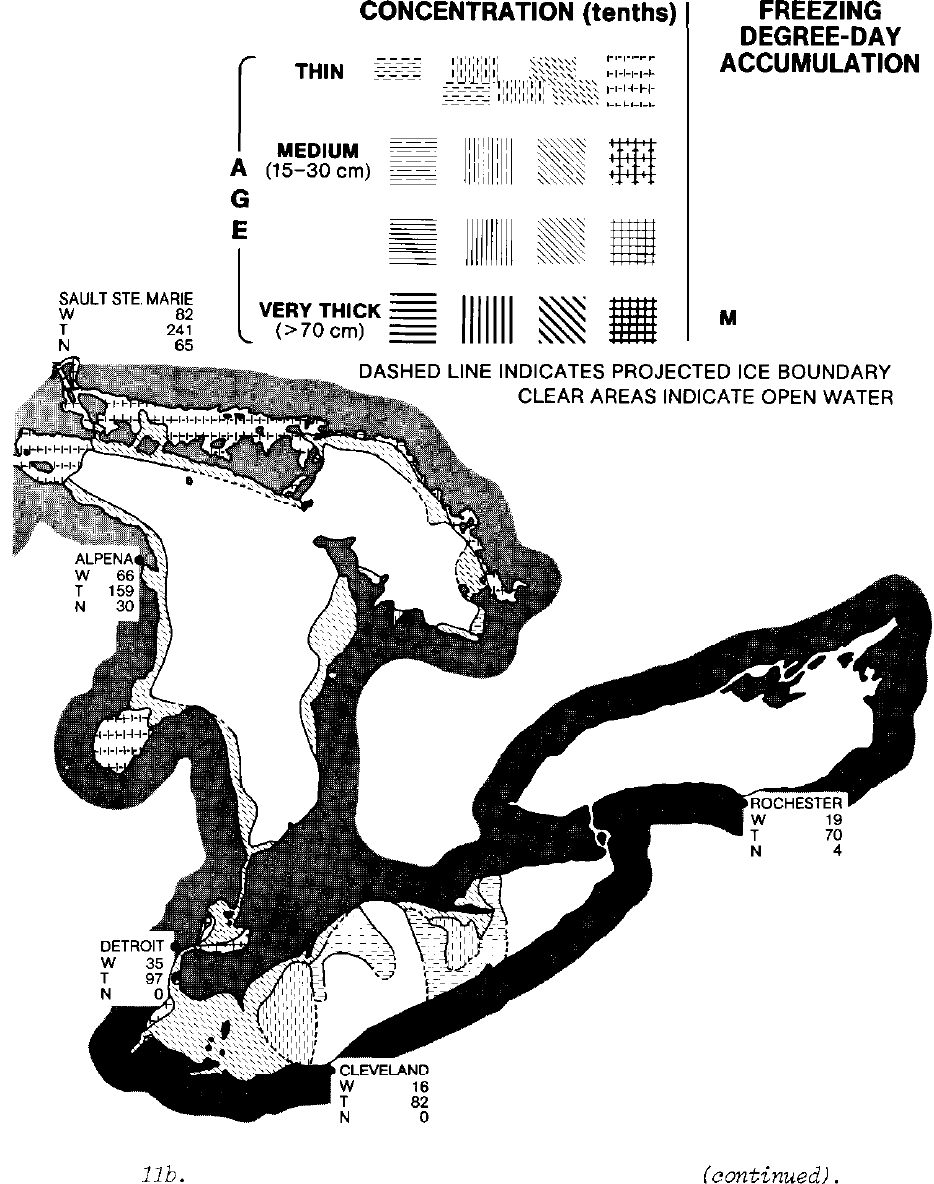
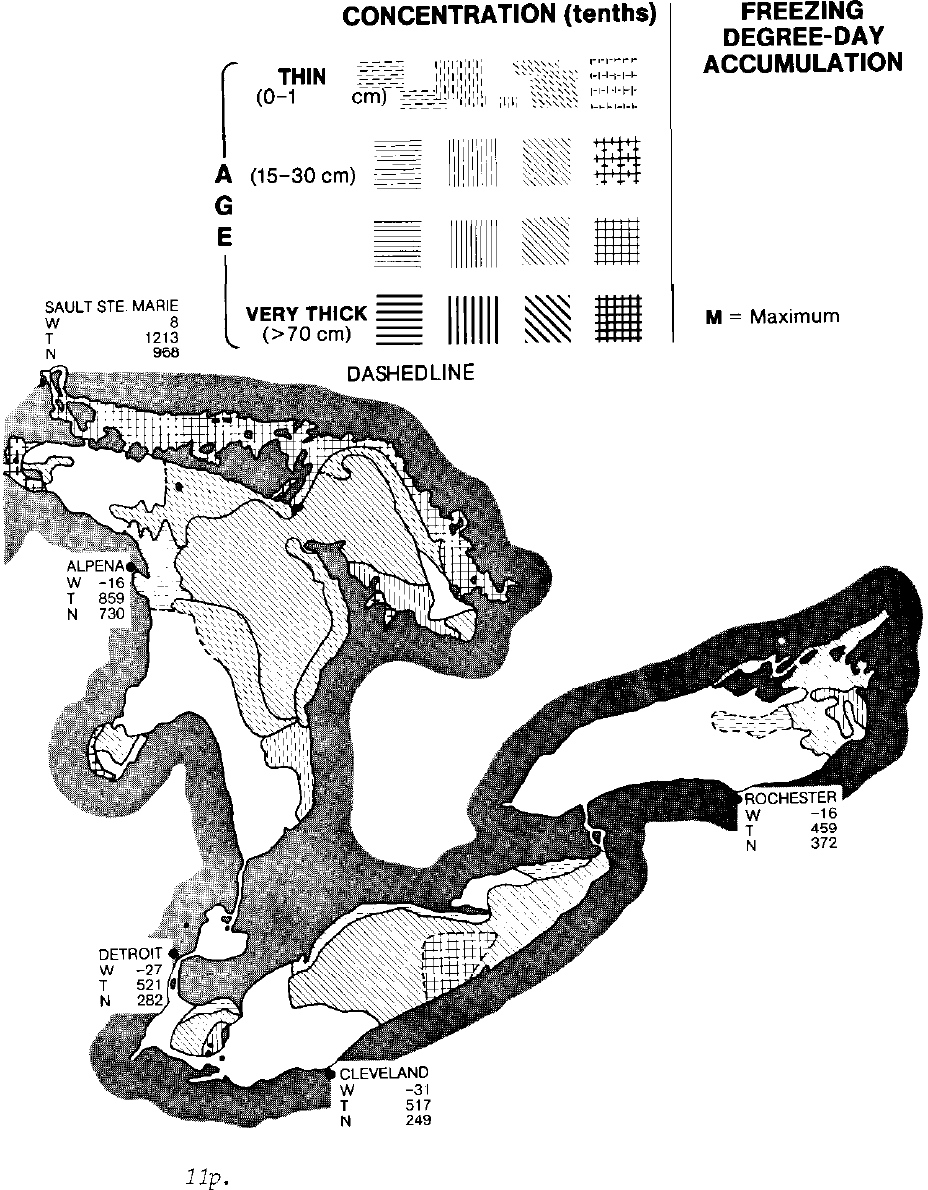
3.2.2 Ice Formation and Breakup Phases
The general seasonal pattern of ice formation and decay is illus-
trated by a series of 21 weekly composite ice charts (Fig.
lla-u).
These charts were compiled from available ice charts and supplementary
ice-cover data as described in Section 3.1.
FDD accumulations
("C)
at
eight representative locations are included as an indication of winter
severity.
The
FDD's
were calculated from average weekly temperatures
given in the Weekly Weather and Crop
BuLLetin.
In addition to the
composite ice charts, 54 satellite images (Figs.
12a-bbb)
document
synoptic ice conditions for given dates throughout the 1976-77 ice
cycle.
Two methods were used to estimate the percent of each lake that was
ice covered.
From ice charts, measurements of areas of different ice
concentrations were made directly by planimeter.
From satellite imagery,
the percent of ice cover was estimated by visual observation.
At almost the same time in early December the winter of 1976-77
produced ice in various shallow protected areas of the Great Lakes.
Lake St. Clair was virtually frozen over by early January.
The re-
mainder of the Great Lakes neared maximum area1 ice coverage by the
first week of February.
Spring breakup started in the last half of
February on the southern part of the Great Lakes and in the first week
in March on the northern part of the Great Lakes.
In general, open
water areas first appeared
lakeward
of the western and northern shores
37
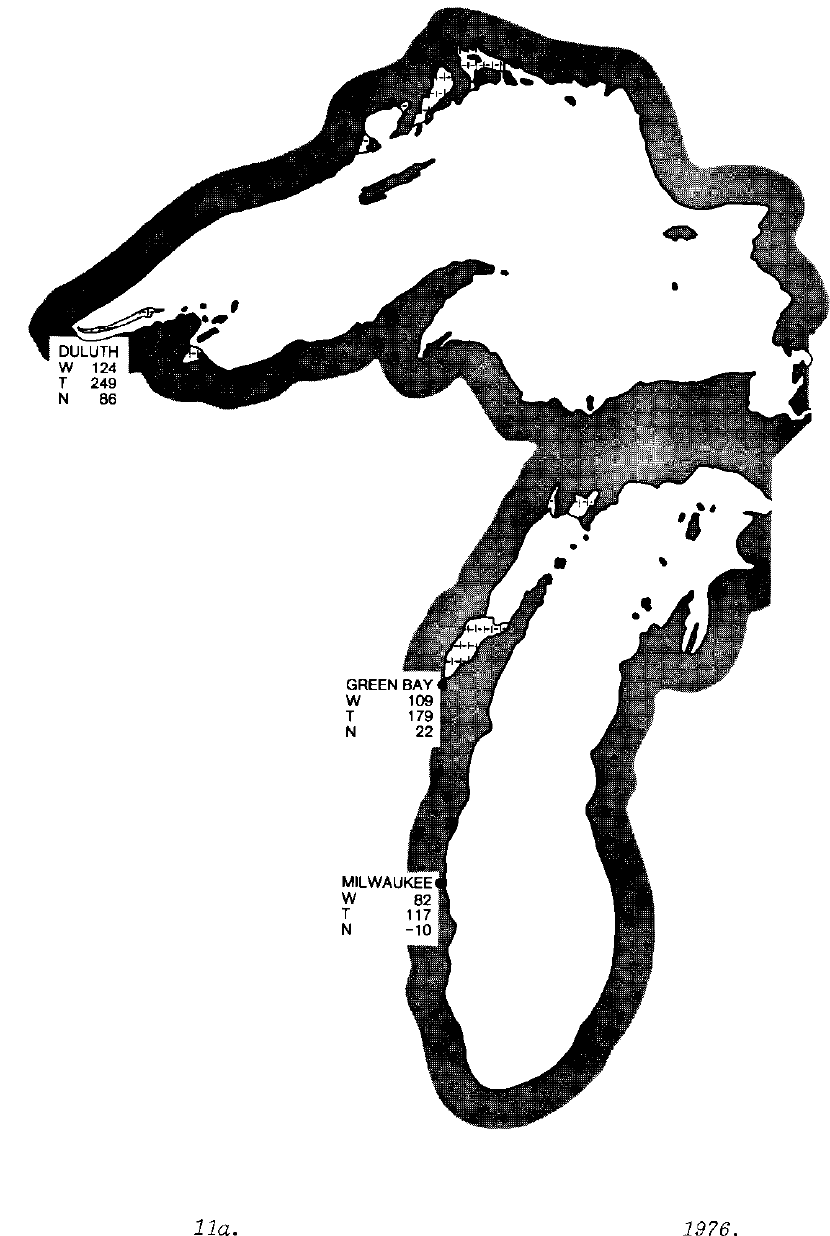
Figure
lla.
Composite ice chart for 5 December
1976.
38

LEGEND
CONCENTRATION
(tenths)
l-3
4-6
7-9 10
(O-15cm)
;z?z
,,,,,,,,,,,,
$$$$
‘:+t[
T”,N
SE%;;
ii#$#
3:::‘:
r;:,;;
G
Q
E
THICK
E
(30-70 cm)
z
SAULT STE. MARIE
Y
:kz
FREEZING
DEGREE-DAY
ACCUMULATION
W = Weekly Total
1
= Cumulative
i%‘y
N = Normal
Cumulative
Weekly Total
M = Maximum
Figure
lla.
Composite ice chart for 5 December 1976 (continued).
39

Figure
lib.
Composite ice chart for 12 December 1976.
40
LEGEND
CONCENTRATION
(tenths)
)
l-3 4-6 7-9 10
T”,N
:::s:;
;~$#$I~
$p
::;:I:;:;;
(O-15 cm)
-;
~~$;~!~;I~$
$3;:
v+;:[
G
E
THICK
(30-70 cm)
=
SAULT STE. MARIE
;”
2x
N
65
-
FREEZING
DEGREE-DAY
ACCUMULATION
W = Weekly Total
T = Cumulative
Weekly
Total
N = Normal
Cumulative
Weekly Total
M
= Maximum
Figure
lib.
Composite ice chart for 12 December 1976
(continuedl.
41

Figure
llc.
Cmposite
ice chart for 19 December 1976.
42

LEGEND
CONCENTRATION
(tenths)
FREEZING
1-3
4-6
7-9 10
DEGREE-DAY
TH,N
sac:;
;i;i;i;i;i;j
FS$
:;:I,,
ACCUMULATION
(O-15cm)
E$z
~$$~~~!+
&?$
r+:';+[
W = Weekly Total
I
MEDIUM
A
(1~30cm)
s
=
I~(~j~/~ii~
#
#
T =
ce;$tive
G
Total
i
THICK
E
(30-70 cm)
E
N = Normal
Cumulative
Weekly Total
SAULT
SE
MARE
Y
2z
I
“:%E~
=
1111111
8
M
= Maximum
N
Figure
llc.
Composite ice chart for 19 December 1976 (continued).
43

Figure
lid.
Composite ice chart for 26 December 1976.
44

LEGEND
CONCENTRATION
(tenths)
FREEZING
l-3
4-6
7-9 10
DEGREE-DAY
,.,./~.,.~
T,,,N
:zgfz::
!/!~!,:/!/$
$$$,j
,MA-,.,-1.
ACCUMULATION
(O-15 cm)
Ezzz
~~~~$!~$f$
ss$j
!:~::::;:
W = Weekly Total
I
MEDIUM
A
(1~30cm)
T = Cumulative
Weekly
G
Total
E
THICK
ZZii!
(30-70 cm)
EZE
N = Normal
Cumulative
Weekly Total
SAULT
SE
MARIE
Y
3:;
M
= Maximum
N
178
Figure
lid.
Composite ice chart
for
26 December 1976 (continued).
45

Figure
lie.
Composite ice chart
for
2 January 1977.
46

LEGEND
CONCENTRATION
(tenths)
FREEZING
l-3
4-6
7-9 10
DEGREE-DAY
r,-,-~-~~
THIN
;I%::!:
~/~$~~~/~/
3$j$
,-,~t.,.,.
I.
ACCUMULATION
(O-15 cm) Ez?z
~~~~~~~~~~~~
&s\
w;::;
W = Weekly Total
T = Cumulative
Weekly
Total
THICK
EEZ
(30-70cm)
S
N = Normal
Cumulative
Weekly Total
SAULT STE. MARIE
Y
121
M
= Maximum
N
Figure
lie.
Composite ice chart for 2 January 1977 (continued).
47

Figure
llf.
Composite ice chart for 9 January 1977.
48

LEGEND
CONCENTRATION
(tenths)
l-3
4-6 7-9 10
THIN
-1
l;I;l;l;l;l;
=
‘I’,‘/‘,‘,‘,
,;::\\,,>
,mY--1~1-
‘::;:\
sul-,H-+
(O-15 cm) Ezz:;
~;~$!$;~;$
ST?\
w::[~:
MEDIUM
+I-
7
!~I~'~
i,~i
A
(15-30
cm)
~1
:,
!
!,,I
G
FREEZING
DEGREE-DAY
ACCUMULATION
W = Weekly Total
T = Cumulative
Weekly
Total
N = Normal
Cumulative
Weekly Total
M
= Maximum
Figure 11s.
Composite ice chart for 9 January 1977 (continued).
49

Figure llg. Composite ice chart for 16 January 1977.
50

LEGEND
CONCENTRATION
(tenths)
FREEZING
l-3 4-6 7-9 10
DEGREE-DAY
1
TH,N
~~~Z~
;//~$i;/;/;/
$33
:;:;,;I
ACCUMULATION
(O-15
cm)
zz$$
~;$!~~I~/~$
$$A
‘:;,:t[
W = Weekly Total
A
$E~;“f,)
z
/~/~)~I~~!~
##
$$j
G
T=
~$,I,tive
THICK
EEE
N = Normal
(30-70 cm)
E
Cumulative
Weekly Total
SAULT STE. MARIE
Y
12s
M
= Maximum
716
*n,
Figure llg.
&npsite
ice chart for 16 January 1977 (continued).
51
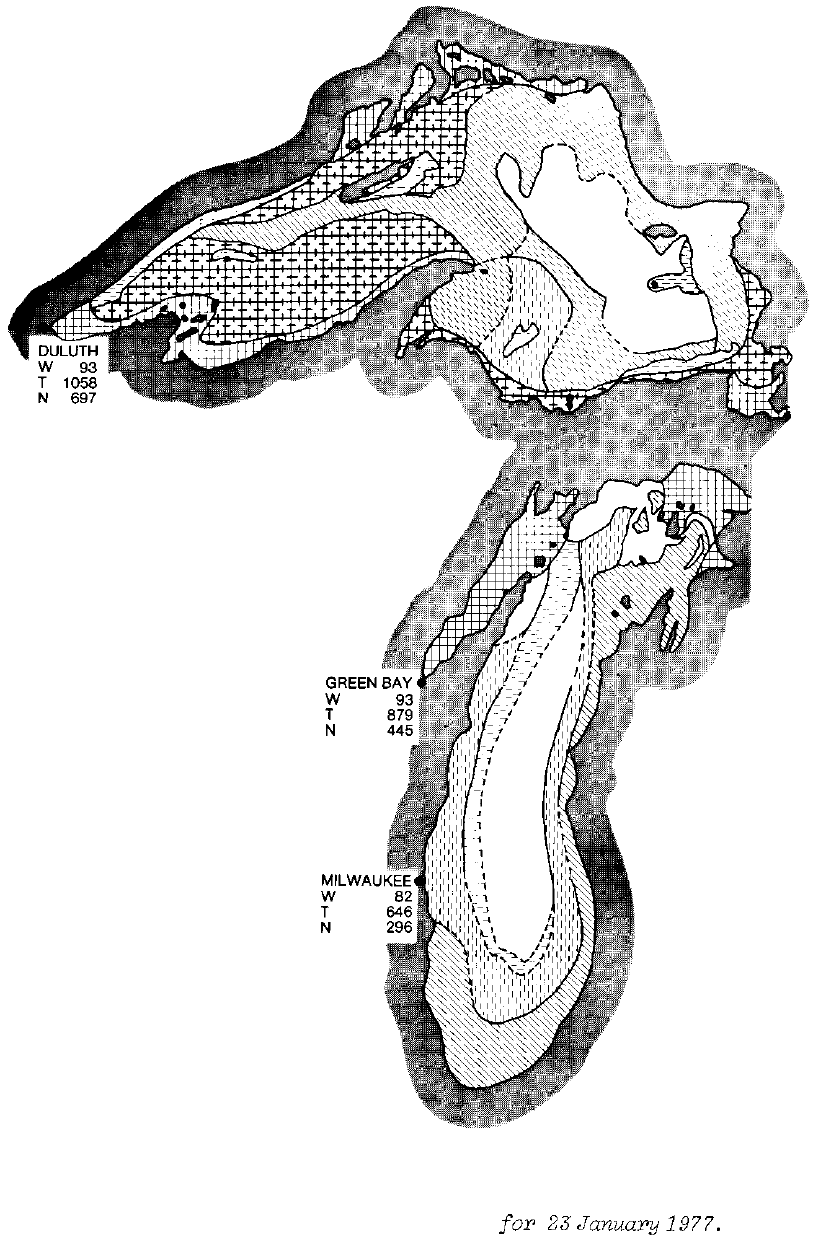
Figure llh. Composite ice chart
for
23
Januaq
1977.
52

LEGEND
CONCENTRATION
(tenths)
FREEZING
l-3
4-6
7-9 10
DEGREE-DAY
,.,.,~,~_,.
T,,,N
;:;:::;z
;i;/$~;~$$
32s
,H,~,~,-+
ACCUMULATION
(O-15 cm)
zE:z
~j~;$~/~~~~;
s,s\
I::::~:;;:
W = Weekly Total
T = Cumulative
Weekly
G
Total
N = Normal
Cumulative
Weekly Total
SAULT STE. MARlE
?
a::
M
= Maximum
N
474
Figure llh.
Composite ice chart for 23 January 1977 (continued).
53

Figure lli. Composite ice chart for
30
January 1977.
54

LEGEND
CONCENTRATION
(tenths)
FREEZING
l-3 4-6 7-9 10
DEGREE-DAY
(D-t5cm)
S?k?z
,,,,,,,,,,,,
$&j
‘:~:‘~
f,,,N
;!:zz
ii\iiiiiiiii
““‘*
:;&I;;
ACCUMULATION
W = Weekly Total
MEDIUM
A
(1~30cm)
gg/
T = Cumulative
Weekly
Total
u
N = Normal
(30-70 cm)
Cumulative
Weekly Total
M
= Maximum
HED
LINE INDICATES PROJECTED ICE BOUNDARY
CLEAR AREAS INDICATE OPEN WATER
Figure lli.
Composite ice chart
for
30 January 1977 (continued).
55

Figure
llj.
Composite ice chart
for
6 February 1977.
56

LEGEND
CONCENTRATION
(tenths)
FREEZING
l-3 4-6 7-9 10
DEGREE-DAY
T,,,N
$!E:::z
;~;i;i$;$
$$$$
::;:I,;;
ACCUMULATION
(O-15 cm) Ezz$
~!~~~/1#
&s$
w;:tL
W = Weekly Total
T = Cumulative
Weekly
G
Total
N = Normal
Cumulative
Weekly Total
SAUL1
STE. MARIE
Y
SE
M
= Maximum
N
me
Figure
113.
Composite ice chart
for
6 February 1977 (continued).
57

L
-
“--,
_---_l_---

LEGEND
CONCENTRATION
(tenths)
FREEZING
l-3
4-6 7-9
10
DEGREE-DAY
.------7
,J,,,N
yIcz:
;i;i;i;i$$
$33
:;,;;
ACCUMULATION
(0-t5cm)
5::
~i~$~;~:~:
924
‘:r:[[
W = Weekly Total
I
MEDIUM
A
(t5-30cm)
E
G
THICK
(30-70 cm)
=
T = Cumulative
i2Fy
N = Normal
Cumulative
Weekly Total
SAULT STE. MARIE
Y
IOE
M
= Maximum
Figure
Ilk.
Composite ice chart
for
13 February 1977 (continued).
59

Figure 111.
Composite ice chart for 20 February 1977.
60

LEGEND
CONCENTRATION
(tenths)
FREEZING
l-3
4-6
7-9 10
DEGREE-DAY
i
,-,-,-~-r~
T,,,N
:I%:::;
;i//i$$$
s,@
,-,-,<-,A
ACCUMULATION
(O-15 cm)
zzz;
~j~!$~~;~;~!
$&
!::+;::
W = Weekly Total
A
({!!A”$,)
ysi
ilI~;l~~~l~
~
#
G
T
=
$$/;tive
SAULT STE. MARIE
?
4
N
THICK
ZEE
N = Normal
Cumulative
Weekly Total
M
= Maximum
Figure 111.
Composite ice chart
for
20 February 1977 (continued).
61
.

Figure 1 lm.
Composite ice chart
for
27
February
1977.
62

LEGEND
CONCENTRATION
(tenths)
l-3
4-6
7-9 10
r,-,--?l_
TH,N
:;:zz
l~iiiilil~li
+::c
,.l.l.,.l&
(0-15cm)
;zzr?
;!;~$;~;!;!
$88
w+[[
G
E
THICK
(30-70cm)
E
FREEZING
DEGREE-DAY
ACCUMULATION
W = Weekly Total
T = Cumulative
Weekly
Total
N = Normal
Cumulative
Weekly Total
M
= Maximum
Figure
llm.
Composite ice chart
for
27
February 1977
icontinued).
63

Figure
lln.
Composite ice chart for 6 March 1977.
64

LEGEND
CONCENTRATION
(tenths)
_____
-
-.
FREEZING
l-3 A-6
7,
._
.-
.-
9
10
DEGREE-DAY
r,-,-,-~_
T”,N
~{:~I;;
ii#/j;jii
$82
b-l-l-,-,-i
(O-15cm)
~~~~
1,1,1,1,1,1,
s$:<
!:;L:::[
ACCUMULATION
W = Weekly Total
I
MEDIUM
E
~;~)~~~~~~I
~
$#
A
(t5-30cm)
go
T = Cumulative
Weekly
G
Total
E
~~~
~~
THICK
Es
llllll//ll
ss
iEM
N = Normal
(30-70 cm)
k
_
/llllI//ll
ss
EEB
Cumulative
Weekly Total
SAULT
STE.
MARIE
Y
12s
l
I
M
= Maximum
N
Figure
lln.
Composite ice chart for
6
March 1977
lcontinuedi.
65

Figure 110.
Composite ice chart
for
13 March 1977.
66

LEGEND
CONCENTRATION
(tenths)
FREEZING
l-3
4-6
7-9 10
DEGREE-DAY
r,~,~Frp
T”,N
$~:;I~;
;$$/;/;/$
$@
,M-~,~,A
ACCUMULATION
(O-15 cm)
SK:
~~$/1!~;/~/~
$$$
!::z:'[
W = Weekly Total
I
MEDIUM
A
(1~30cm)
E
T = Cumulative
G
+%:ly
N = Normal
Cumulative
Weekly Total
SAULT
SE
MARIE
4”
120:
M
= Maximum
N
Figure 110.
Composite ice chart for 13 March 1977
icontinuedl.
67

GREEN
BAY
w
Figure 11~. Composite ice
cchazt
for
20 March 1977.
68
LEGEND
CONCENTRATION
(tenths)
FREEZING
l-3 4-6
7-9 10
DEGREE-DAY
(O-1
5
cm)
$~r~x~~
,,,,,,
,,,,,
@$<
!:J;:::[
T”,N
;ge~
;#j/i/i
‘;Q:::
::;;:,;_;
ACCUMULATION
W = Weekly Total
I
MEDIUM
A
(15~30cm)
G
G
THICK
E
(30-70 cm)
E
T = Cumulative
Weekly
Total
N = Normal
Cumulative
Weekly Total
HED
LINE
INDICATES PROJECTED ICE BOUNDARY
CLEAR AREAS INDICATE OPEN WATER
Figure
lip.
Composite ice chart for 20 March 1977 (continued).
69

Figure llq.
Composite ice chart
for
27 March 1977.
70

LEGEND
CONCENTRATION
(tenths)
l-3
4-6
7-9 10
T”,N
f:zFIe;
;//~;#i$i$
3::e
[A,:;;
.A:::>\.
(O-15 cm) EzzF
$!$[i$
&$
‘:;::[
MEDIUM
A
(t5-30cm)
s
G
i
THICK
(30-70 cm)
=
SAULT STE. MARIE
Y
12z
N
986
FREEZING
DEGREE-DAY
ACCUMULATION
W = Weekly Total
T = Cumulative
Y%Ply
N = Normal
Cumulative
Weekly Total
M
= Maximum
Figure
llq.
Composite ice chart for 27 March 1977
icontinuedl.

Figure
11~.
Composite ice chart for 3 April 1977.
72

LEGEND
CONCENTRATION
(tenths)
FREEZING
l-3 4-6 7-9 10
DEGREE-DAY
,~,~,~,-7y
T”,,,
~:fz~::$
:~i#!~!~
$@
,w+~,-L
ACCUMULATION
(O-15 cm)
Ezzz
~$~!~~((
s$$
r’;:::;:
W = Weekly Total
I
A
(?i-E:;%)
G
T = Cumulative
Weekly
Total
SAULT STE. MARIE
4”
12,:
N
N = Normal
Cumulative
Weekly Total
M
= Maximum
Figure
11~.
Composite ice chart
for
3 April 1977 (continued).
73

Figure 11s. Composite ice chart
for
10 April 1977.
74

LEGEND
CONCENTRATION
(tenths)
FREEZING
l-3 4-6
7-9 10
DEGREE-DAY
r-,--r?
THIN
:::z:z:z
;#!i!i;i
23:
+,,*-I+
ACCUMULATION
(O-15
cm)
~:~:~I~
~1~$;~~~#
&$
Iwr-Fk
I.LL8.L
W = Weekly Total
T =
ce;$tive
G
Total
E
(30-70 cm)
E
N = Normal
Cumulative
Weekly Total
SAULT
SE.
MARIE
Y
M
= Maximum
N
Figure 11s. Composite ice chart
for
10
April
1977 (continued).
75

Figure
lit.
Composite ice chart
for
17
ApriZ
1977.
76

LEGEND
CONCENTRATION
(tenths)
l-3
4-6
7-9 10
THIN
=
,iIiIi,i,i,i
/;$I$$
<<;;;*
rl-J-(---
:;;y+
8.,4-,-,-L
(O-15cm)
~~~~
,,,,,,,,,,
,,
$@
“::;::
G
E
THICK
(30-70 cm)
E
SAULT STE. MARIE
-
-
Y
,;zi
VERY THICK
=
N
966
(>70cm)
z
1111111
8
FREEZING
DEGREE-DAY
ACCUMULATION
W = Weekly Total
T = Cumulative
Weekly
Total
N = Normal
Cumulative
Weekly Total
M
= Maximum
Figure
lit.
Composite ice chart for 17 April 1977 (continued).
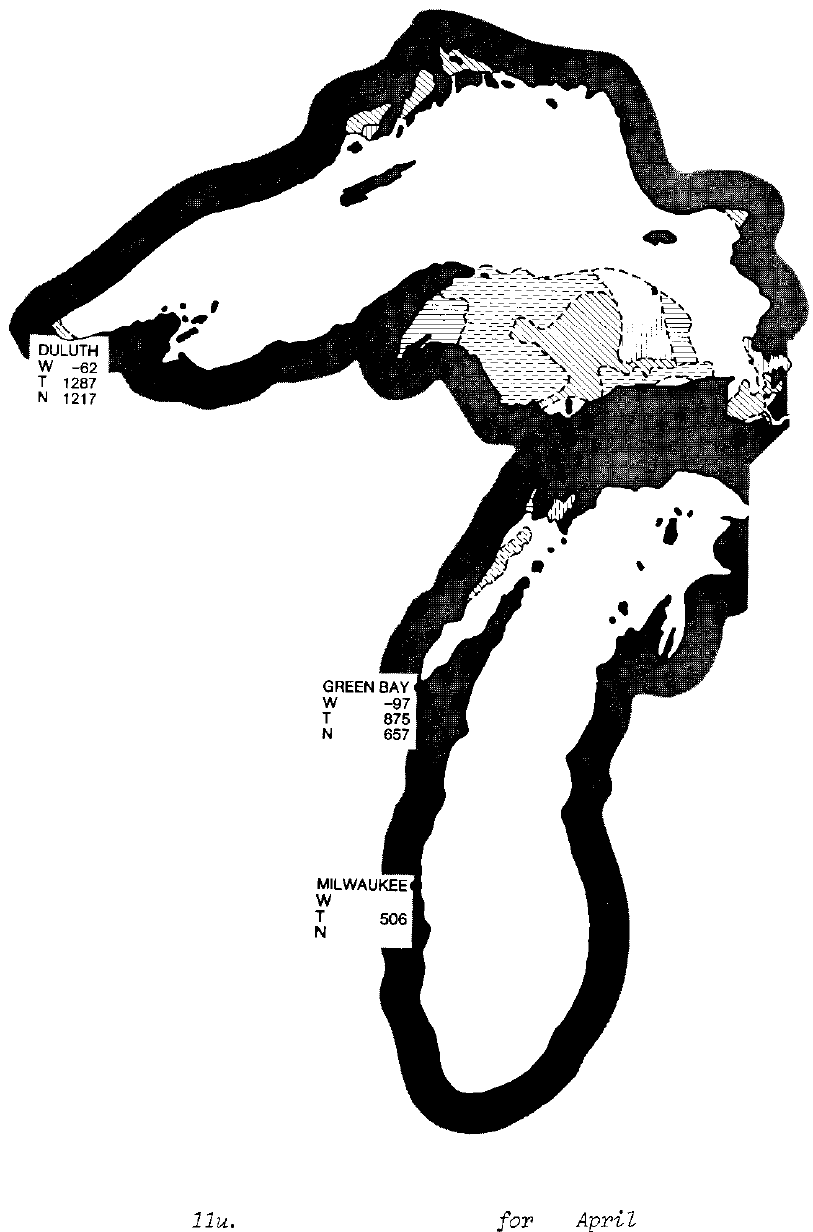
Y
-89
506
N
354
Figure
11~.
Composite ice chart
for
24
April
1977.
78

LEGEND
CONCENTRATION
(tenths)
l-3
4-6 7-9 10
,-,-,-,--~
T”,N
::z::s
;/qil#
@$
i-,-*-I+
(O-15
cm)
gGI?F~
/~$/!;!I;;~
&$
“;:t[
MEDIUM
A
(15-30cm)
e
G
E
THICK
E
(30-70 cm)
ZFZ
SAULT STE. MARIE
4”
-70
,136
N
924
FREEZING
DEGREE-DAY
ACCUMULATION
W = Weekly Total
T = Cumulative
Y%:‘y
N = Normal
Cumulative
Weekly Total
M
= Maximum
Figure llu.
Campsite
ice chart
for
24 April 1977 (continued).
79
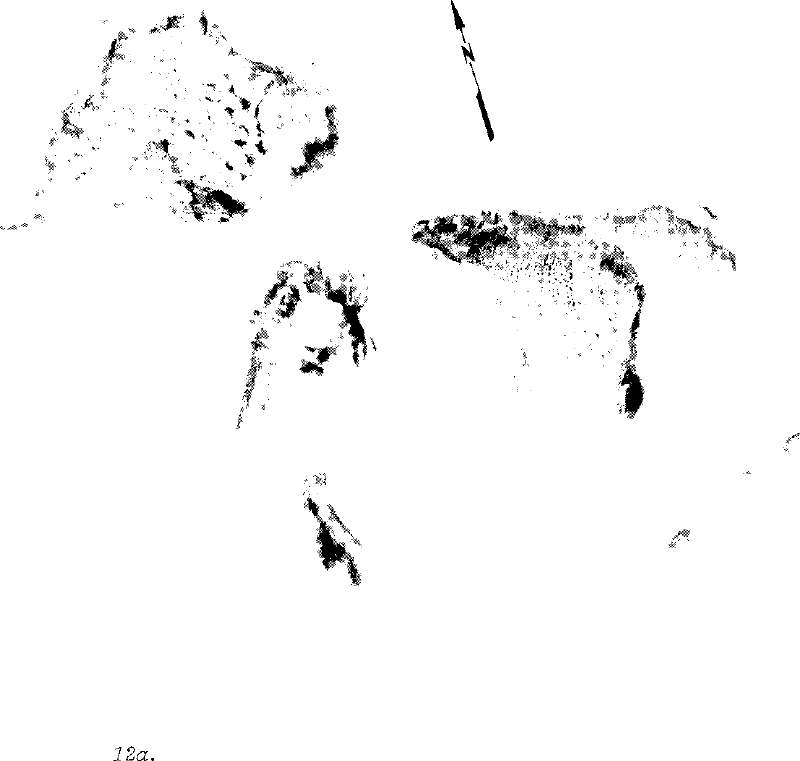
.
.
.--
?
N
\
Figure
12a.
NOAA-5 VHRR-IR image for 9 January 1977.
80

Figure
1%.
NOAA-5 VHRR-IR image
for
13 January
1977.

Figure
12~.
GOES VISSR
(visiblei
image
for 16
January
1977.
Figure
12d.
GOES VISSR (visible) image for 18 January 1977.
82

Figure
1%.
GOES
VISSR
IvisibZe)
image
for
25 January 1977.
83

Figure
12f.
NOAA-5
VIIRR
(visible) image for 1
February
1977.
84

Figure
12g.
DOAA-5
VHRR
(visibkl
image
for
7 February 1977.
85

Figure
12h.
NOM-5 VHRR (visible) image
for
10 February 1977.
86

Figure
12i.
GOES
VISSR
(visibZel
image for
22
February
1977.
87

Figure
l&j.
NOM-5
VHRR
(visible) image
for
1
March 1977.
88
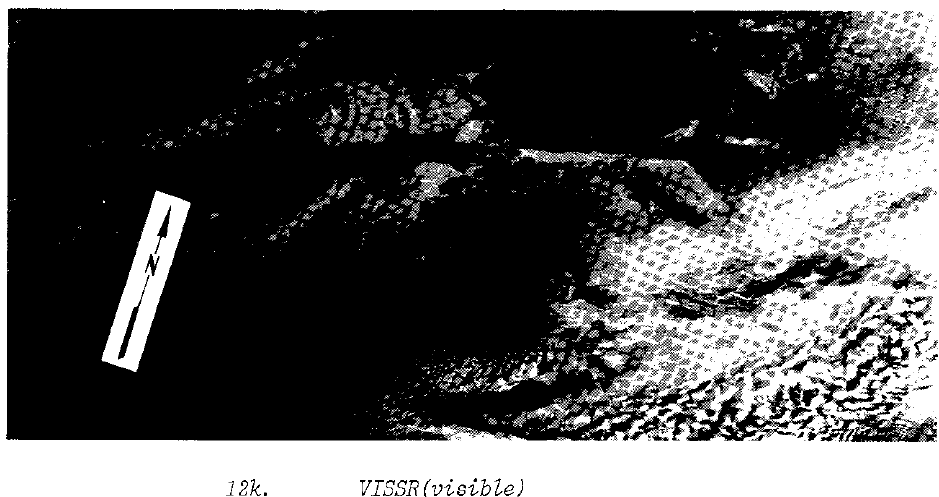
Figure
12k.
GOES
VISSR
(visibLei
image for 7 March 1977.
89

Figure 121.
NOAA-5 VHRR
ivisibLe)
image for 8 March 1977.
90

%
f
’
k
?
2
I,
2
z
?I
F.
z
5
4’
2
Y
2
5
2
s
E
::
..,
.,_
.-
,_.,
,_
,,,.
..,.,
,.,,
._,,,
..,.,,
.,,,,
I,.,
..,
_”
-
.
,.,,
,,
,,
.~
~
,.”

Figure 12~. GOES VISSR (visible) image
for
25 March
1977.
!
image for 6 April 1977.
Figure 120.
GOES VISSR
(visibk
92

Figure
12~.
NOM-5 VHRR
lvisibLel
image
for
9
ApriL
1977.
93

Figure
12q.
NOAA-5 VHRR (visible) image for 14
April
1977.
94

Figure 12~.
NOAA-5 VHRR (visible) image for 22 April 1977.
95

Figure 12s.
NOAA-5 VHRR (visible) image for 25 April 1977.
96

,,..
:_.I
.
-~-.
__^
-,-.,,~-~,
^__.,,~
3
73
2
k
?
s
?E
I,
3
F
I.4
2
Q
s
$
Y
2
3
2
Y
,”
2
2
&
:
2
2

Figure
12~.
NOAA-5 VHRR-IR (daytime) image for
11
January 1977.
98
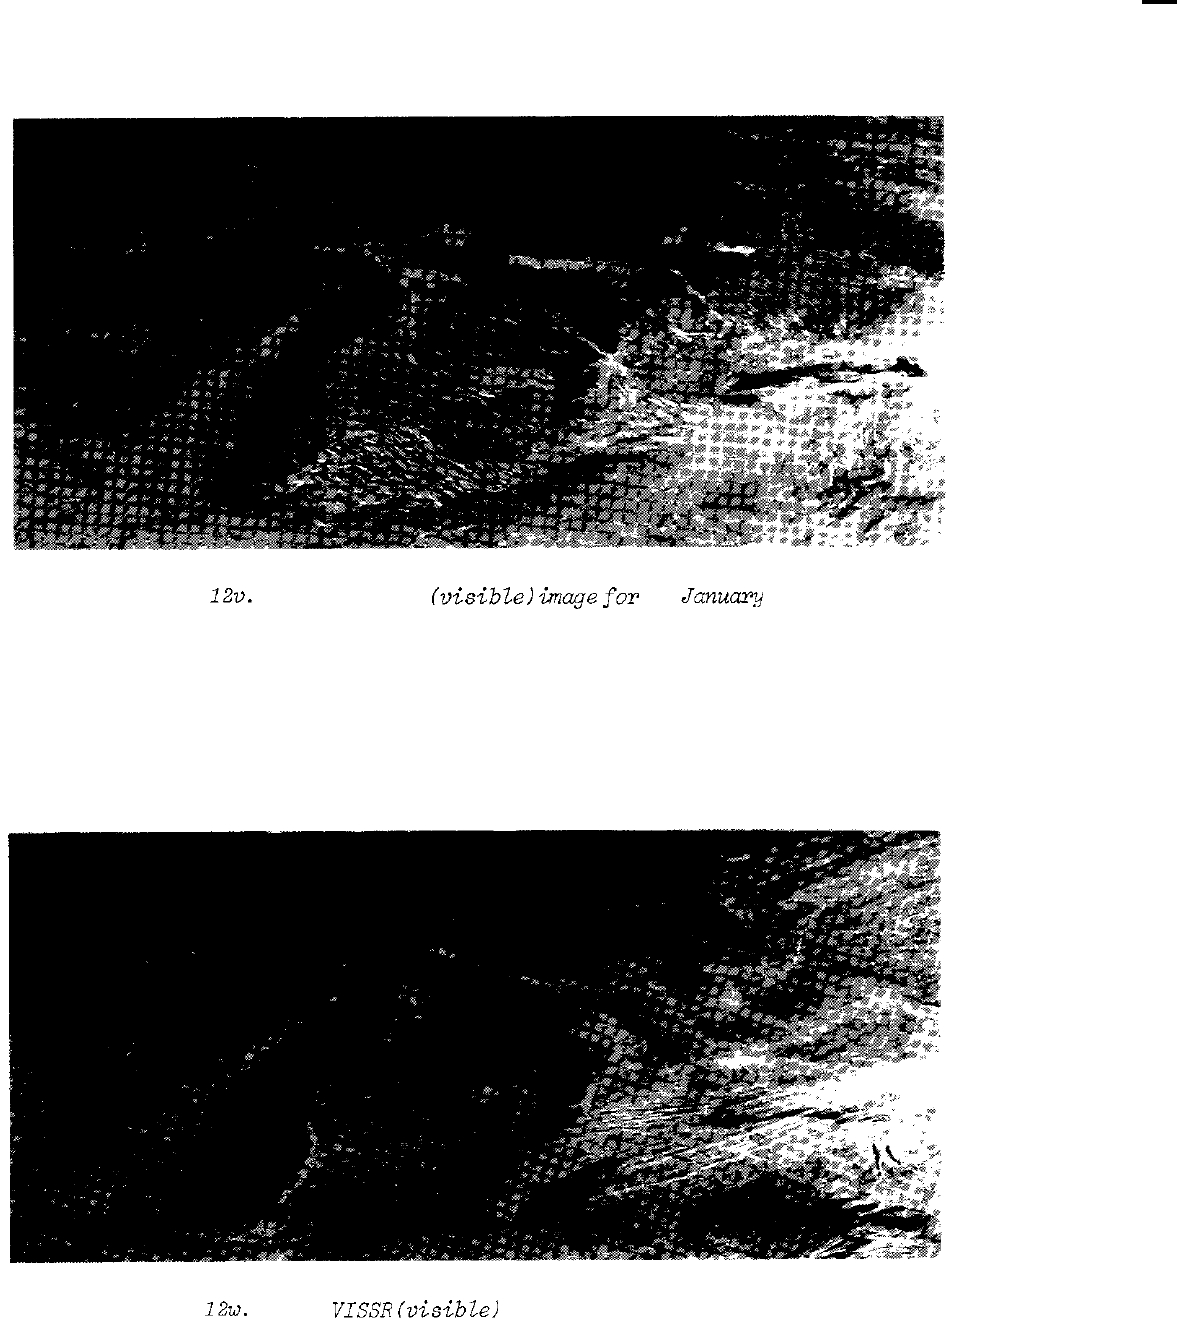
Figure
12~.
GOES VISSR
Ivisible)
image
for
21
Januw
1977.
Figure
12~.
GOES
VISSR
ivisibtel
image for 27 January 1977.
99

Figure 12x. GOES
VISSR
CvisibZe)
image for 16 February 1977.
100

Figure
12~.
NOAA-5 VHRR (visible) image
for
16 March
1977.
101

Figure
122.
NOAA-5 VHRR
ivisibI.ei
image
for
22 March 1977.
102

Figure
12aa.
NOM-5 VHRR-IR (nighttime) image for 8 December 1977.
103
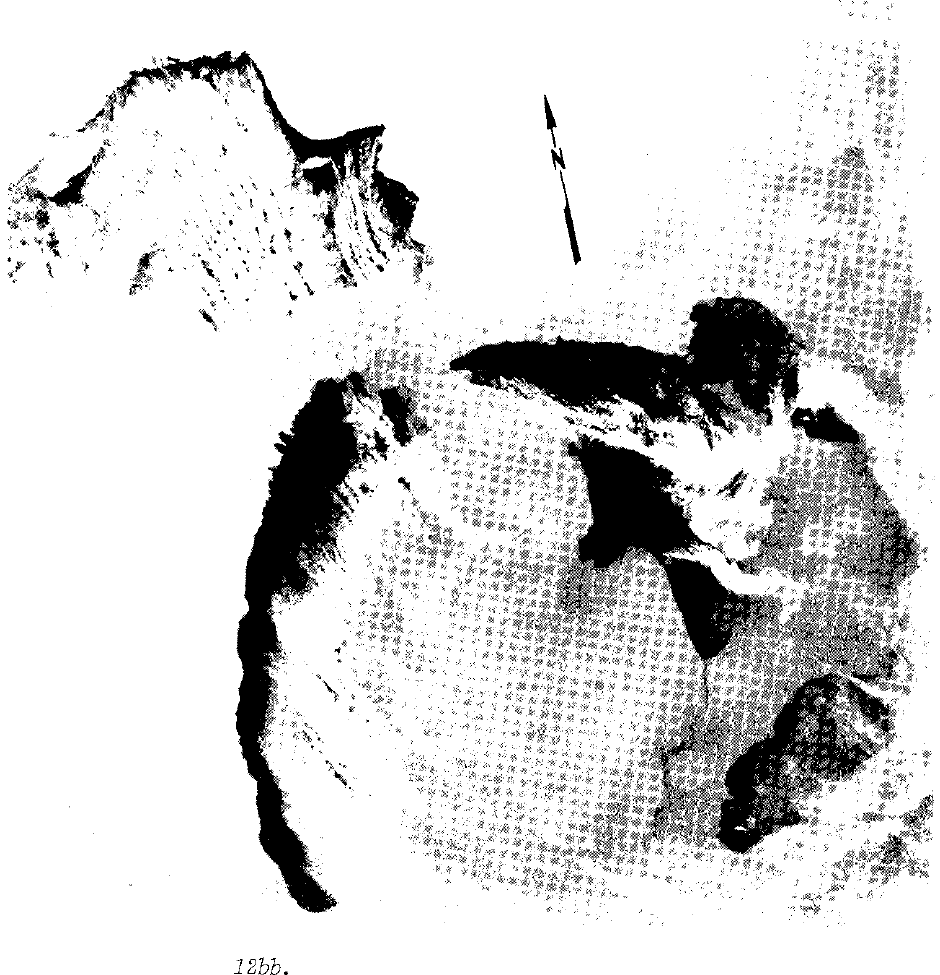
Figure
12bb.
NOAA-5 VHRR-IR image for 7 January 1977.
104

Figure
ZZcc.
GOES VISSR (visible) image
for
9 February 1977.
Figure
12dd.
GOES
VISSR
(visible) image
for
10 February 1977.
105

Figure 12ee.
GOES VISSR (visible) image
for
15
Febmary
1977.
Figure
12ff.
GOES VISSR
CvisibLe)
image for 28 February 1977.
106

Figure
IZgg.
GOES
VISSR
CvisibZe)
image
for
17
March 1977.
107

Figure
12hh.
NOAA VHRR (visible) image
for
24 March 1977.
108

Figure
l&i.
GOES VISSR (visible) image for 29 March 1977.
Figure
1Zjj.
GOES VISSR (visible) image
for
3 April 1977.
109

Figure 1Zkk.
GOES
VISSR
CvisibZel
image for 8
ApiZ
1977.
110

Figure
12lZ.
NOM VHRR (visible) image
for
11 March 1977.
111

Figure
12mm.
GOES VISSR
lvisiblel
image for 27 December 1977.
Figure
1Znn.
GOES VISSR
CvisibZe)
image for 9 January 1977.
112

Figure 1200. GOES VISSR (visible) image for 7 February 1977.
Figure
12pp.
GOES VISSR
CvisibZel
image for 21 February 1977.
113

Figure 1Zqq.
GOES VISSR (visible) image
for
1 March 1977.
Figure
l%rr.
GOES
VISSR
(visible) image
for
2
March 1977.
114

Figure 12s~. GOES VISSR (visible) image for 8 March 1977.
Figure
12tt.
GOES VISSR
CvisibZel
image for 9 March 1977.
115

Figum
12~~.
GOES
VISSR
ivisibtel
imqe
for 19 March 1977.
Figure
12~~.
GOES
USSR
(visible)
image for 21
Mm-ch
1977.
116

Figure
12~~.
GOES VISSR
ivisibLe)
image
for
24 March 1977.
Figure
12~~.
GOES
VISSR
(visibZel
image for 25 March 1977.
117

Figure
12yy.
GOES
VISSR
ivisibLe)
image
for
27 March 1977.
Figure
12~.
GOES
USSR
(visible) image
for
30
March 1977.
118

Figure l%aaa.
GOES VISSR (visible) image
ford
9
Apri?,
1977.
Figure
1Zbbb.
GOES VISSR (visible) image for ii April 1977.
119

of the Great Lakes and gradually expanded east and south. The bulk of
the ice was gone by 24 April. Areas of ice on that date included the
southeastern shore of Lake Superior, Green Bay in Lake Michigan, the
North Channel and the Georgian Bay in Lake Huron, and the Buffalo
vicinity on eastern Lake Erie.
3.2.3 The Ice Cycle on Lake Superior
Ice was first reported forming along the shore of Whitefish Bay on
8 November.
By early December, Nipigon, Black, and Thunder Bays had
also developed major ice covers (Fig.
lla).
Significant ice developed
around the lake shoreline by 2 January, from 2 to 4 weeks earlier than
normal (Fig.
lie).
The ice formation steadily progressed so that by 9
January the western end of the lake from Keweenaw Point to Duluth was
primarily ice covered (Fig.
llfl.
On 9 January fast ice formed along the entire northern shore of
Lake Superior,
responding to the bitter cold weather (Fig.
12~).
Keweenaw Bay became covered by new ice and the entire western prong of
the lake was ice covered from shore to shore.
By 11 January westerly
winds had moved the ice away from the
Bayfield
and Ashland, Wis.,
shoreline,
opening north-south leads in the ice; the deeper portions of
the lake continued to remain open water.
Northwesterly winds on 11 and
12 January began to
move
the pack ice away from the northern shore in
the vicinity of Nipigon Bay and out into the lake south of Isle
Royale.
However, directly south of Isle
Royale,
in the lee of the island, there
was relatively little ice.
The western third of the lake appeared to be
completely ice covered.
Thermal imagery on 13 January (Fig.
12b)
showed a wide lead extending south from the Apostle Islands to the south
shore.
Other leads (east-west) could be seen in the Duluth area.
The
large mass of ice adjacent to the southern shore of the Keweenaw Penin-
sula had been moved offshore, but new ice quickly formed. The ice to
the east of Isle
Royale
had broken into floes and was moving south and
east.
More than half the lake was covered by ice.
Ice formed in the eastern lake basin during the second half of
January (Figs. llg-i).
Around 16 January northerly winds caused a
pileup of ice along the northwestern shore of the Keweenaw Peninsula.
By 18 January,
vast
areas of the northern shore of the lake were blown
free of ice (Fig.
12d).
Only the area between Isle
Royale
and the
mainland retained its ice. "Warmer"
water
from the lake bottom was
upwelling along the shore and the ice pack moved to the center of the
lake and toward the southern shore.
On 25 (Fig.
12e)
and 27 January the Apostle Islands were again the
scene of a large lead,
as westerly winds broke up the ice, moved it out
of bays,
and caused ridging. By 1 February 1977 the entire northern
shore, from Michipicoten Bay to Two Harbors, was ice free, except for
ice around Isle
Royale
(Fig.
12f).
Despite the record low temperatures,
Lake Superior was now only about 25 percent ice covered.
120

In February the low temperatures and northwesterly winds persisted,
causing rapid ice formation (Fig.
12g).
Lake Superior was near maximum
ice cover for the 1976-77 winter in early February and again in late
February (Figs.
llj-m).
The percent of lake surface covered by ice on
both 6 and 27 February is estimated to be 83 percent. The ice cover in
the mid-lake areas of the eastern and western basins was estimated to be
primarily thin to medium ice,
i.e., up to 30 cm in thickness, with ice
near the shore areas as thick as 70 cm.
These thickness values refer to
natural ice growth on open lake areas and not to rafted or windblown
ice,
or to ice growth in harbors and sheltered portions of bays where
ice thickness can exceed 70 cm. On 9 February the temperature at Duluth
rose to
7"C,
marking the first time it went above freezing since 18
December.
On the 10th (Fig.
12h)
large leads continued to persist.
The
ice far offshore was very fractured and less reflective and darker in
appearance.
By 13 February the winds had moved the ice 70 km off the
northern shore, but Whitefish Bay was solid and ridged. On 22 February
a long lead was observed along the southern shore and a second lead had
developed from Cape
Gargantua,
south toward Whitefish Point (Fig.
12i).
The ice formation period continued up to the second week in March, with
changes in ice configuration as shown in Figures
llj-0.
On
1 March the
northern shore was ice free and a circular area of open water about 50
km
in diameter was observed
east
of the Keweenaw Peninsula. A lead east
of the Apostle Islands is seen in Figure
12k
for 7 March.
Also on 7
March the pack ice west of Keweenaw Point was well fractured and of low
reflectance in the northern part, indicative of melting; the temperature
reached 5°C
at
Duluth.
Pack ice completely filled the eastern half of
the lake and long curving leads were evident in the pack.
On 8 March
southwesterly winds of 10 mph opened a lead on the southern shore (Fig.
121)
and Duluth recorded its warmest day
(13'C).
The next day, 9 March,
the lead along the
southern
shore, off Marquette,
Mich.,
widened con-
siderably.
For the next few days easterly winds again moved the pack
offshore, as by this time it was a detached mass of ice.
The decay period lasted approximately 6 weeks, from mid-March to
the end of April.
The pattern of ice-cover loss proceeded from north
t0
south.
Large areas of open water occurred
lakeward
of the northern
shore and generally north of a line from the Apostle Islands to Marathon,
Ont., by the end of the third week in March (Fig.
Up).
On 21 March the
lake was still more than half covered by ice, with the northern shore
and outer Keweenaw Bay clear (Fig.
12m).
The next day the ice was
.seen
to be rotten, lacy,
and melting throughout, with large floes detectable.
At Duluth temperatures reached 7°C.
On 25 March further separation of
the large floes were seen in the western part of the lake (Fig.
12~2).
The mean monthly Duluth temperature for March was
4.4'C
above normal.
The open-water areas in the western basin, west of Keweenaw Point,
occurred
along
both the northern and southern shores in late March (Fig.
llq)
and new ice formed along the northern shore in early April (Fig.
UP).
BY
3 April Michipicoten Bay was no longer ice bound and by 6
April only
a
few
large floes were noted north of Grand
Marais,
Mich.
121

(Fig.
120).
Only about 20 percent of the lake retained ice (Fig.
12~)
by 9 April. Patches of ice still persisted off the Apostle Islands and
north of Grand
Marais
on 14 April (Fig.
12q).
However, by the end of
the second week of April the bulk of the ice was gone from the western
basin (Fig.
11s).
The general pattern of ice loss the first half of April was by
expansion'of
the open water area along the north shore with the
main
mass of ice left in the eastern basin located east of a line between
Marathon, Ont.,
and Munising,
Mich.
(Fig. llt). This ice changed
configuration during the following week and was reduced in extent.
The
only significant ice left in the lake in late April was located in bays
and harbors (Fig.
11~).
On 22 April the lake ice north of Isle
Royale
was gone (Fig.
12~).
Three days later the bulk of the ice was gone from
Whitefish Bay (Fig. 12s) and 1 day later, on the
26th,
Thunder Bay and
the Apostle Islands were virtually ice free as well. In late April only
some vestiges of ice were still apparent in Duluth Harbor,
Keweenaw
Bay,
east of Marquette, and in Black and Nipigon Bays.
3.2.4 The Ice Cycle on Lake Michigan
First reports of ice formation came from Green Bay during the
second week in November.
On 3 December ice was detected east of the
Straits of Mackinac,
in the Big Bay de
Not,
in south Green Bay, and off
Chicago.
By 5 December an extensive ice cover had formed in the south-
ern half and the northern extremities of Green Bay (Fig.
11~).
The
following week, 12 December, ice was forming along the entire length of
Green Bay, along the northern shore of Lake Michigan, north of Green
B=Y,
and in the Straits of Mackinac extending to Beaver Island.
By the
13th most of Green Bay was ice covered (Fig.
12t).
The ice off Chicago
disappeared, but reappeared in the area on 21 December.
Ice had also
formed along the southern perimeter of the lake by late December, as
shown in Figure
lid.
On 30 December ice was seen forming off the entire
western shore of the lake in response to subzero temperatures.
Green
Bay was iced in for the winter and ice was also forming on the eastern
shore.
The ice configuration remained relatively stable through early
January (Figs.
llc-e).
The extent of the ice cover illustrated in
Figure
lid
is similar to that given by Rondy (1971) for normal winter
early season ice cover for the period 25 January to 5 February. During
January the ice cover increased in extent and concentration over the
entire lake so that by the end of the month the lake north of a line
from Little Bay de
Not
to Grand Traverse Bay was almost
100-percent
ice
covered and ice concentrations of 40
to
90 percent extended
lakeward
from the shore south of this line (Fig.
lli).
The ice-cover configu-
ration at this time was greater than the maximum ice cover given by
Rondy (1971) for a normal winter and it was occurring a month earlier.
By 7 January the Straits of Mackinac were solidly frozen out to
Beaver Island and ice was forming in Grand Traverse Bay and all along
122

the eastern shore.
By 11 January ice had formed from shore out to 25 km
off Chicago (Fig.
12~).
Westerly winds continued to cause upwelling,
chilling, and freezing along the western shore, constantly moving the
newly formed ice offshore. By 21 January the ice was observed in the
Michigan City,
Ind.-Benton
Harbor,
Mich.,
area (Fig.
12~).
On 27
January a wind-gathered ice accumulation of 15 km nestled along the
eastern shore and more new ice had rapidly formed along the western
shore (Fig.
12~).
The cold and winds continued and on 7 February Lake
Michigan was frozen from east to west,
virtually entirely ice covered.
The narrow lead extending all along the western shore and a few small
areas of open water proved to be the only non-ice areas (Fig.
llj
and
1%).
During February there were large changes in ice cover as much of
the ice that formed in the mid-lake area and along the southwestern
shore was transported by wind and currents or melted by upwelling of
warmer water (Fig. Ilk-m). On 8 February, with a strong northerly wind
at Chicago,
a long lead paralleling the shore developed from Chicago to
Benton
Harbor.
On 9 and 10 February the southwestern winds cleared the
western quarter of the lake (Fig.
12h).
Chicago became ice free. On
14-17 February northerly winds drove the ice away from portions of the
northern shore and broke up the large ice pack along the eastern shore
(Fig.
12~).
On 23 February the ice was severely brecciated by north-
eastern winds and breakup had begun in earnest.
During the breakup period, ice-cover loss progressed from the
southern end of the lake (Figs.
110-r)
to the open lake area of the
northern portion, north of a line from Green Bay to Grand Traverse Bay
(Figs.
Up-s).
The last ice cover to dissipate was in the Straits of
Mackinac out to Beaver Island and in Green Bay (Figs.
UP-U).
During the first few days of March,
northerly currents began to
carry the loose pack ice away from the western edge of the pack and
toward Chicago in spite of southerly winds (Fig.
12j).
but later,
westerly winds pushed the mobile ice again to the east with a prominent
ridge line showing up at the ice pack's leading edge.
Next the pack "as
forced northward along the eastern shore by southwesterly winds, and the
northwestern edge of the ice began to bulge toward the Door Peninsula.
But the warming of March was not to be denied.
By 16 March only a third
of the lake was covered by ice (Fig.
12~).
By 19 March the pack was
badly brecciated and broken, and only the Straits of Mackinac had solid
shore to shore.
The Green Bay ice cover was beginning to thaw and
ii';2
March
Grand Traverse Bay and areas in the straits were also thaw-
ing (Fig. 122).
Open
water
was seen in Green Bay on 24 March and by 29
March the pack was largely sastrugi.
On 9 April Grand Traverse and Green Bay ice was breaking into floes
(Fig.
12~).
A lead through the Straits of Mackinac could be seen.
TWO
days later,
on 11 April, Green Bay Harbor was ice free, but the bay
itself still contained numerous large floes, despite 16°C temperatures.
123

The long thin ice field off Washington Island lasted until about 25
April (Fig. 129). The last Lake Michigan ice was observed in Green Bay
in late April.
Ice was estimated to
cover
90 percent and 84 percent of Lake Michi-
gan on 6 and 20 February, respectively.
The extent of the ice cover
makes the 1976-77 ice cycle comparable to and perhaps more severe than
the 1962-63 ice cycle.
Rondy (1971) classified the 1962-63 winter as
severe for Lake Michigan.
3.2.5 The Ice Cycle on Lake Huron
The first observed ice cover on Lake Huron formed in Saginaw Bay
during the first week in December (Fig.
11~).
By the end of the next
week,
ice formation was taking place along the entire perimeter of the
lake, and the Straits of Mackinac to Bois Blanc Island were frozen over,
as was Saginaw Bay (Fig.
lib).
In general, ice cover increased in
December and January (Figs.
llc-i)
and reached its maximum
area1
cover-
age in February (Figs.
llj-2).
The early season ice cover, i.e., that
in December and January, was more extensive than normal
(Randy,
1971).
By 15 December Saginaw Bay was frozen from north to south, and ice
was noted in the North Channel of Georgian Bay (Fig. 12t). By 30 Decem-
ber Georgian Bay was half covered by ice and fast ice was on almost
every shore of the lake.
By 7 January the lake was producing ice all
along the southwest shore from Cheboygan to Port Huron (Fig.
12bb).
By
9 January the North Channel was frozen solid and the north half of
Georgian Bay was ice bound.
The southern basin was rapidly clogging
with ice (Fig.
12~).
On the 11th northwesterly winds blew the ice to
the eastern shore and away from Alpena (Fig.
12~).
The westerlies
continued,
and by 13 January the southern basin was completely ice
covered (Fig. 12b).
By the 19th of January Georgian Bay was ice covered
except for the leads along the western edge (i.e., the eastern side of
Manitoulin
Island).
On 27 January the lake was about 90 percent ice
covered.
From 27 January to 22 February (27 days) Lake Huron remained
nearly
90-percent
ice covered.
On 9 February southwesterly winds pushed
the ice away from the western shore, opening a large lead in outer
Saginaw Bay (Fig. 12~).
The next day five leads, primarily oriented
northeast-southwest, were formed in the southern basin in response to
southeastern winds (Fig. 12&Q.
The Port Huron area appeared to be open
from Port
Sanilac,
Mich.,
to Port Huron,
while fast ice was evident
along the Canadian shore.
Portions of the St. Clair River appeared to
be ice free.
By 15 February the western shore from the outer portion of
Saginaw Bay to Alpena was virtually ice free. The ice was then against
the Bruce Peninsula and
arcuate
ridges and fractures paralleled the
coastline (Fig.
12ee).
The Georgian Bay ice had pulled away from the
north shore with leads and cracks producing large floes.
A large con-
centration of ice collected from Cheboygan,
Mich.,
to North Point, but
the lake mouth of
Manito
Y
lin Island was rather free of ice except for a
single floe, about 15 km
, west of Great Duck Island.
On 17 February
124

the lowest temperatures of the month occurred and the lake was nearly
VO-percent ice covered (Fig.
12~).
Subsequently, on 20 February the
north winds returned and forced the ice southward, causing a jagged
lead
to open from
Manitoulin
Island to a point about 25 km west of Southamp-
ton, Ont.
By 22 February the winds had changed from north to south to
northeast and only a small area north of Pointe Aux Barques was free of
ice (Fig.
12;).
By 28 February several days of westerly winds had reduced the ice
cover along western shores of the lake except for inner Saginaw Bay
(Fig.
12~@f).
The first of March marked the clear beginning of the
breakup process (Fig. 12j).
During the breakup period ice was first
lost along the southwestern shore from Port Huron to Alpena,
Mich.,
es
eluding
Saginaw Bay (Figs.
llm-0).
Westerly winds and high temperatures
freed much of the western shore except for the Mackinac Island area by 8
March (Fig.
12b).
On 11 March a lead extended through the pack ice from
a point 25 km east of Great Duck Island to a point on the Canadian shore
10 km south of Southampton in response to easterly winds, but this was
closed by 14 March.
By 17 March warm weather and northwesterly winds
concentrated the ice against the Canadian shore, and in Georgian Bay the
western half of the Bay was ice free except for some large floes (Fig.
l%g)
.
On 19 March the brecciated ice pack was no longer tied to the
shore.
Even the ice in Saginaw Bay was adrift.
Georgian Bay ice was
detached, but shelf ice still clung to the eastern shore of the bay.
The lake area between Alpena, Bois Blanc Island, and the North Channel
became ice free the third week in March (Fig.
11~).
Pack ice moved
south on 24 March,
moving inshore some 10 km south of Southampton.
o=lY
a thin band of floating ice barred entrance to Georgian Bay (Fig.
12hh).
Saginaw Bay was almost clear of ice as was the entrance of Georgian Bay
on
25
March.
The main
mass
of ice in Lake Huron appeared to be composed
of melting floes along the eastern shore on the 29th (Fig.
12ii).
The
breakup pattern the last few days of March and into early April, in
general, was characterized by open-water areas that appeared along
the
northwestern and southwestern shores.
These open-water areas merged to
free the entire western shore and moved eastward (Figs.
llq-r).
On 3
April the U.S. portion of the lake was ice free and the eastern
shore
still contained the main mass of pack ice left in the lake (Fig.
12~3).
On 8 April
the Straits of Mackinac appeared to be open, but not ice free
(Fig.
12kk).
An ice floe about 50 km in diameter was concentrated
against the Bruce Peninsula.
A patch of open water appeared in the
North Channel at
Meldrum
Bay.
By 25 April Georgian Bay and the North
Channel were ice free (Fig. 12s).
The ice in Lake Huron was last ob-
served on 26 April. The next day the temperature reached 26°C at
Alpena.
3.2.6 The Ice Cycle on Lake St. Clair
Lake St. Clair had an extensive ice cover by the end of the first
week in December (Fig.
lla
and
12aa).
On 15 December the ice
was
blown
toward the Canadian (eastern) side by southwesterly winds and open water
125

extended all along the U.S. side.
This condition persisted through 18
December.
The lake was completely frozen over by 2 January.
The lake
stayed like a frozen tundra for almost 60 days.
On 10 February a small
open area was detected at the head of the Detroit River (Fig.
12h).
By
19 February the open area had enlarged.
Daytime temperatures were well
above freezing.
The open area slowly increased in size and on 1 March a
patch of open water was seen adjacent to the northern channel of the St.
Clair River at the northern end of the lake (Fig. 12j).
On 8 March the
reflectance of the lake ice was noticeably less, a sign of melting (Fig.
122).
On 11 March Anchor Bay near New Baltimore,
Mich.,
was ice free.
By 16 March the ice pack had receded to the eastern shore and covered
about a third of the lake (Fig.
12~).
By 19 March only a few isolated
fragments of ice remained.
The lake lost its ice cover on 20 March
(Fig.
llf).
3.2.7 The Ice Cycle on Lake Erie
As on other Great Lakes,
the ice-cover formation period started
about a month earlier than normal on Lake Erie. By 5 December the
western end of the lake had a
70-
to VO-percent ice cover (Fig.
11~).
An infrared nighttime NOAA-5 image from 8 December clearly revealed
extensive ice floes covering more than half of Lake Erie's western
basin.
The ice was thin and mobile (Fig. 12~).
On 15 December a large
mass of ice was detected between Point
Pelee
and Point
aux
Pins in the
central basin.
By 21 December the ice in the western basin and the
western part of the central basin was forming at a rapid rate.
By 26
December (Fig.
lid)
the ice cover extended from Toledo, Ohio, on the
western end of the lake to Buffalo on the eastern end, with the ex-
ception
df
open water
lakeward
of an area from Buffalo to Long Point.
The following week, 2 January, much of this open-water area also formed
ice and the western basin was totally ice covered (Fig.
lie).
On 9
January the central basin was virtually ice covered as was the entire
lake on 11 January (Figs.
12~
and 12%). Lake Erie remained nearly
frozen for 44 days.
From time to time the northwesterly winds would
move
the ice off the northern shore and force the ice to compact, but as
the ice moved offshore,
upwelling warmer water would be brought to the
surface and frozen.
Westerly winds constantly broke loose the ice in
the
Pelee
Island area and moved it to the east.
On the satellite images
it is not possible to identify the western basin as a water body as it
had the thermal and visible characteristics of a land mass.
The eastern
end of the lake,
the deepest area, was also impossible to identify as
water.
The ice cover is estimated to have reached maximum
area1
extent (in
excess of 99 percent) during the first week in February (Fig.
llj).
Area1
coverage remained relatively unchanged through the next week,
beginning on 13 February (Fig.
Ilk), but the last half of the month
brought some minor decrease in ice concentration as the ice formation
period
came to
an end (Figs.
112-m).
126
On 10 February several very small patches of open water appeared on
the Ohio shoreline in the vicinity of Sandusky,
Lorain,
and Cleveland.
On 16 February the ever-present north-south lead in the Pelee Island
area opened and new ice was produced. Breakup probably began about 24
February, and by 26 February it was well underway.
The high temperature
for Toledo for the month,
16'C,
had been reached the previous day.
The first of March saw a typical early thaw pattern for Lake Erie
ice (Fig.
12j).
The western portion of the central basin began clearing
from west to east owing to westerly winds.
A large open-water area
formed between Point Pelee and a point east of Cleveland the first week
in March.
Monroe and Toledo Harbors showed their first open-water
areas, too.
But the remainder of the lake was from
70-
to
lOO-percent
ice covered (Fig.
llm).
A lead
40-km
long developed along the shore
east of Pointe
aux
Pins. Cleveland Harbor was opened on 2 March and
Sandusky was opened on 10 March.
The eastward moving ice was clearing
faster along the southern shore.
The ice in the western basin, as
usual, was melting on a separate ice pack. By 16 March it was located
just west of Point Pelee (Fig.
12~).
Northwest winds pushed the pack
away from the northern shore and open water,
lo-20
km wide, extended
from the
Welland
Canal to the Detroit River.
The brecciated and frag-
mented nature of the main pack was now evident. By the third week of
March the open water had expanded to encompass most of the shore area of
the western end of the lake.
Thin ice or open water also extended along
the northern shore (Fig.
11~).
The western basin was ice free on 24
March (Fig.
12hh).
The last week in March the main mass of ice left in
the lake was located along the southeastern shore between Cleveland and
Buffalo (Fig.
llq).
By 29 March the pack, floating offshore except at
Buffalo, was rotten and lacy and had low reflectance (Fig.
12ii).
By 10 April (Fig.
11s)
Lake Erie was ice free with the exception of
the Buffalo area.
Ice extended from
Dunkirk,
N.Y., to Buffalo along the
shore out to 5-10 km and a
Uplug"
at Buffalo formed for the second
straight year.
The "plug" melted about 29 April 1977, and ice was last
reported in Buffalo on 30 April.
There were at least 141 days when ice
was present in Lake Erie.
3.2.8 The Ice Cycle on Lake Ontario
Ice formation in the open lake began in early January (Fig.
lie),
although ice was reported forming in bays and harbors in early December.
Ice first formed in the shallow northeastern section of the lake,
proceeding westward and along the northern and eastern shores (Figs.
llf--j).
The first ice noted in satellite imagery on 27 December was in
the northeastern part of the lake near its outlet into the St. Lawrence
River (Fig.
12mm).
By 9 January ice was well formed in the Sacketts
Harbor-Amherst Island area and along the eastern shore (Fig.
12mm).
The lake was estimated to have its greatest
area1
ice coverage in
early February, when 38 percent of its surface was ice covered.
There
127

were significant changes in ice configuration during February
and
early
March (Figs. Ilk-m) and total
area1
coverage was estimated to be
20
percent the end of the first week in March.
On 7 February it appeared that the entire eastern third of the lake
was ice covered and that ice was forming all along the northern shore
and at the western end, but some clouds were present, making the inter-
pretation somewhat uncertain (Fig. 1200).
The fifteenth of February had
ice extending
lo-20
la
offshore of Canada (Fig. 12ee).
The eastern end
of the lake from about Fair Haven, N.Y., east had heavy ice concentra-
tions.
On 21 February ice was concentrated from just east of Rochester,
N.Y., to the southeastern shore of the lake, with the edge of the ice
pack extending to the northeast (Fig.
12ff).
By 1 March a large pack of ice was concentrated east of a line from
Fair Haven to the Bay of Quinte, and the edge of the windblown pack was
oriented north-south (Fig.
12qq).
A good clear image was obtained on 2
March and fast ice was noted from Cobourg, Ont., to the Bay of Quinte,
where it merged with the main pack (Fig.
12~~).
On 8 March, as a result
of prior southwesterly winds,
the ice pack's lake edge was oriented
southeast-northwest from Oswego, N.Y., to Wellington, Ont. (Fig.
12s~).
Sodus
Bay and Irondequoit Bay were still ice covered.
On 9 March a
large open-water area developed in the vicinity of Amherst Island at the
entrance
to
the St. Lawrence River (Fig. 12tt). Notable decreases in
the main mass of ice, located in the northeastern section of the lake,
occurred between 13 and 20 March (Figs. 110-p). The ice melted in place
until 18 March;
then, on 19 March it was observed that the ice pack was
disintegrating and migrating westward toward the center of the lake
(Fig.
12~).
By 21 March the winds again were consolidating the pack in
the northeastern section (Fig.
12~~).
From 24 through 27 March north-
westerly winds pushed the now very mobile pack into the southeastern
corner of the lake,
thus clearing the entrance to the St. Lawrence
entrance of ice (Figs.
12w~-yy,
12ii).
On 29 and 30 March the ice pack
seemed
to
expand as it moved back north, but this effect was undoubtedly
owing to a mobile pack spreading out with reduced concentration of ice
as a result of southerly winds (Fig. 1222).
On 3 April the pack was concentrated in the northeastern area
again, from Kingston, Ont.,
to a point midway along the eastern shore
(Fig.
12jj).
It diminished greatly in size from 8 April (Fig.
12kk)
to
9 April (Fig.
12aaa)
and was again spread southward by the northwesterly
winds.
The melting ice was observed on 17 April (Fig.
12bbb)
and was
completely gone by 24 April (Fig.
11~).
3.3 Comparisons with Previous Winters
By making comparisons of normal ice-cover configuration and dates
given by Rondy (1971) for four periods in the winter, early winter, mid-
winter, maximum ice cover, and early decay, the 1976-77 winter can be
128

put in perspective relative to normal conditions.
Table 5 shows the
dates 1976-77 ice cover was similar to normal ice configuration in the
four winter periods.
From this table it can be seen that ice-cover
configuration similar to normal early winter, mid-winter, and maximum
ice cover occurred on the average of 4 to 5 weeks earlier than normal
during the 1976-77 winter. In addition, while the early decay period
was near normal on Lakes Superior,
Michigan, and Huron, it was approxi-
mately 2 weeks later than normal on Lakes Erie and Ontario.
A second comparison of the 1976-77 winter is made in Table 6, which
shows 1976-77 percent maximum ice extent and those given by Rodgers
(1976.a)
and Leshkevich (1976, 1977) for the Great Lakes during the past
14 winters.
From Table 6, it can be seen that 1976-77 maximum ice
extent was only exceeded by four winters for Lake Superior, no winters
for Lake Michigan, one winter for Lake Huron, and one winter for Lake
Ontario.
No comparisons are made for Lakes Erie and St.
Clair
as they
freeze over most winters.
Table 6 also contains the mean and standard
deviation of maximum ice extent for the past 15 winters on the Great
Lakes.
Defining as normal the mean plus or minus one standard devia-
tion,
the 1976-77 winter can be classified as having above normal
maximum ice extent for Lakes Michigan, Huron, and Ontario and normal ice
extent for Lakes Superior and Erie.
Summarizing,
the 1976-77 ice cover occurred earlier than usual and
was more extensive than usual for the early winter, mid-winter, and
maximum ice extent winter periods.
Ice cover on the entire Great Lakes
in 1976-77 was more severe in many respects than any year during the
past one and one-half decades for which well-documented records exist.
The ice decay period came near the normal date of occurrence on the
northern portion of the Great Lakes, but was later on Lakes Erie and
Ontario.
4.
CONCLUDING REMARKS
D. E. Boyce, C. R. Snider, and D. Weisnet
4.1 Effects on Lakes Commerce
During the winter of 1976-77 waterborne commerce on the Great Lakes
was severely hampered by the abnormally large amount of ice cover and
the long duration of the cover.
Commerce continued throughout the
season, but the iron ore trade from the
lakehead
into southern Lake
Michigan and Lake Erie was suspended for almost 2 months during mid-
winter--the first such break in traffic in 3 years.
Direct icebreaking
assists by the U.S. Coast Guard were up nearly 55 percent over the
"previous season.
129

TabLe
5. Comparison of Dates When Ice Cover
for
1976-77 Was
Similar
in Configuration to Normal Ice Cover
for
Early Winter, Mid-Winter,
Maximurn
Ice Extent, and Early Decay Winter Periods.
---_-~-~ --._~-.
.-.---
“-
,,,.._.
_~.~,,,
;,
,..,
Location
Early
Winter
-id-Winter
Deviation Deviation
1976-77 1976-77
Normal
1976-77
(days)
Normal
1976-77
(d=ys)
Lake Superior
20-30 Jan. 2 Jan.
+18 25 Feb.-S Mar.
9 Jan. f47
Lake Michigan 25 Jan.-5
Feb.
26 Dec.
f30
20-28 Feb. 9 Jan. f42
Lake Huron
25
Jan.-S
Feb.
12 Dec.
f44 25 Feb.-5 Mar.
16 Jan.
+40
Lake Erie
15-25 Jan. 5 Dec.
f41
l-10
Feb.
9 Jan.
+23
Lake Ontario
25
Jan.-S
Feb.
9 Jan.
+16
15-25 Feb. 16 Jan.
+30
Mean
+30
Mean
+36
Location
Fximum
Ice Extent
Deviation
1976-77
Normal
1976-77
Cd=!=)
Normal
Early
Decay-
Deviation
1976-77
1976-77
(days)
Lake Superior 25 Mar.-5
Apr.
23 Jan.
+61
l-10 Apr. 17 Apr.
-7
Lake Michigan 15-25 Mar.
16 Jan. f58 20-30 Mar. 3 Apr. +4
Lake Huron
20-30 Mar. 30 Jan.
+49 25 Mar.-5
Apr.
27 Mar.
0
Lake Erie
20-28 Feb. 6 Feb.
+14 25 Feb.-5
Mar.
20 Mar. -15
Lake Ontario
lo-20
Mar.
27 Feb.
+10
15-25 Mar. 10 Apr. -16
Mean
+38
Mean
-7

Table
6. Comparison of
Maximm
Percent Ice Extent on the Great
Lakes: 1976-77 and Previous Winters
Winter
Superior,
Michigan,
Huron,
Erie,
Ontario,
% % %
% %
1962-63
1963-64
1964-65
1965-66
1966-67
1967-68
1968-69
1969-70
1970-71
1971-72
1972-73
1973-74
1974-75
1975-76
1976-77
Total+'s
Mean ice
extent
Standard
deviation
95
8Oa
+b
31
+
13
+
90
40
+
60
+
15
+
88
46
+
90 30
f
40
+
15
f
80
+
30
+
48
f
27
+
95
45
+
55
+
20
+
70
+
20
+
30
+
25
f
40
+
20
+
83
90
9
14
65
34
58
93
19
97
32
60
29
80
50
50
50
45
70
60
65
45
50
89
25
23
19
6
12
+
-t
+
+
+
+
+
+
+
+
+
+
+
13
98
51
91
12
+
NAC
10
+
NA
15
+
90
12
•t
98
10
+
80 10
+
95
17
+
92
10
+
95
20
+
95
20
f
95
25
+
80
16
+
95
20
+
100
38
NA
13
aAs
given by
Randy
(1971).
b.
+
IS
1976-77 winter had
more
extensive ice cover.
'NA
is not available.
131
With the addition of another
lOOO-ft
vessel
to
the iron ore trade
during the season, tonnage was up over 2 million tons from the previous
year.
By the end of 1976, demands were much lower and the natural ore
season ended in Duluth on 24 October.
Some ships laid up shortly
afterward.
Other ore ships transported grain cargoes during November.
The generally frigid autumn resulted in ice in some navigation
channels in late November in northern lake ports.
By early December the
ice was widespread in many shallow waters and the Coast Guard reported
that damage to navigation aids was the worst in 30 years.
The NWS
predicted the worst ice year on the Great Lakes in over 5 years in a
forecast issued in late November. Only days later the ice began to take
its toll.
A Norwegian ship, Kings Star,
drifted helplessly in Lake Erie
on 1 December. Numerous vessels were pushed out of dredged channels by
the ice and 20 ships had gone aground by the year's end.
The worst
incident was the grounding of the Cliff's
Vietory.
She went hard aground
near Johnson Point in the lower St. Marys River on 9 December, blocking
the two-way channel.
While part of her cargo was off-loaded and tugs
pulled her free, 70 ships went to anchor waiting to transit the river.
At least one of those delayed was a foreign flag ship racing to pick up
in Duluth a cargo bound for Europe before the closing of the St. Lawrence
Seaway system on 18 December.
The U.S. Coast Guard cutter
Brambte
provided the first direct
icebreaking assist of the season when she helped the
E.
M. Ford
and the
Merchant Vessel (M/V)
NicoZet
into Saginaw Bay on 3 December. The next
day the Canadian
Meafoord
was helped in the St. Marys River by the
Nauga-
tuck.
Several vessels were assisted in northern Green Bay by the
AmtndeZ.
The polar icebreaker
Westiind
(Fig. 13)
moved from her
homeport
of
Milwaukee, Wis., to Duluth. She chalked up several assists by
mid-
December.
The closing of the St. Lawrence Seaway was delayed for several days
as exceptionally severe ice conditions hampered efforts
to
get the last
few foreign vessels through the river. Water temperatures on 8 December
were the lowest for that date since the seaway opened in 1959. Shipping
was halted from 12 to 14 December to permit a stable ice cover to form
and thus reduce the likelihood of damage to hydroelectric facilities.
The Liberian freighter
Attica
and the Canadian Seaway
Queen
were the
last ships through the locks; this was on 19 December. Similar ice
problems plagued the
Welland
Canal.
On 3 January the Canadian
Black Bay
was the last ship to travel through the canal.
The
Taurantau
started a
voyage through the canal, but became stuck and stayed near lock 7 for
the winter.
There was little relief in the unrelenting cold in December, and
the Coast Guard had logged 238 icebreaking assists by New Year's Eve.
Preventative icebreaking was also being performed by vessels not de-
ployed to remove seasonal aids to navigation.
Vessel traffic ended on
Lake Erie with the exception of the "coal shovel" run between Toledo and
Detroit.
132

.
-i
:,
,,
.
:,,’
_.
‘,
‘r.
I.,,
Figure 13.
U.S. Coast Guard icebreaker Westwind.
(Photograph courtesy of the U.S. Coast Guard
Air Station, Detroit,
Mich.)
133

As an extremely cold January favored steady ice growth throughout
the Lakes,
icebreaking continued at record levels.
Over 150 vessels
were assisted in the first half of the month owing to some of the worst
conditions of the season.
The Canadian Coast Guard cutter
Gtiffon
attempted to escort the M/V
Canadian Mariner
across Lake Erie, but was
turned back near Long Point.
On 11 January the tanker Amoco
Indiana
went aground in ice near Grand Traverse Bay in Lake Michigan.
There was
concern that the ice might cause an oil pollution incident, but the
vessel was refloated the next day with minimum pollution.
On 17 January the Winter Navigation Board, composed of government
agencies assigned to demonstrate and study the feasibility of winter
navigation on the Great Lakes and St. Lawrence Seaway, announced that
bad weather and ice conditions in Lake Superior and the St. Marys River
were forcing them to close the area to vessel traffic.
The last Ameri-
can vessels cleared the locks on 23 January, ending 34 months of con-
tinuous operation at Sault Ste. Marie.
Ironically,
the same severe
weather that promoted the suspension of winter navigation in western
Lake Superior necessitated shipping into Thunder Bay, Ont., to avert
potential fuel shortages.
The Canadian ships
Doan
Transport, Hudson
Transport, and
Imperia2
St.
Chair
transported fuels and supplies to
Thunder Bay and Sault Ste. Marie, Ont.,
and early February.
on several trips in late January
On 20 January, strong pressure on the moorings of the Little Rapids
Cut ice boom on the St. Marys River broke the structure.
Some ice moved
from Soo Harbor into the cut, but the Sugar Island Ferry continued to
operate.
Four commercial vessels were delayed 2 days while repairs were
made.
Another 80 boats were assisted during the last half of January.
February was a landmark month on the Great Lakes.
For the first
time since 1963 all of the lakes with the exception of Lake Ontario were
nearly
lOO-percent
ice covered.
Fifteen ships continued to sail during
the first week of the month, but icebreaking assists were nearly con-
stant.
One of the Coast Guard's two major lake icebreakers, the
Mackinaw,
was damaged on 3 February.
While working in the St. Marys River, her
port propeller shaft was bent and one blade was sheared off.
Trips into
Lake Superior continued, but the Canadian tankers were able to
move
at
only 1.6 km per hour (1 mile per hour) at times in the l-m thick ice.
The round trip from Sarnia, Ont.,
to Thunder Bay took about 2 weeks.
The weather alternated between cold and mild periods in February.
The milder weather during the last week of the month was sufficient to
loosen river ice in the lower lakes.
It took the Km, the
Amndel,
the
Bramble,
and finally the
Westwind
to break the tough ice near Fairport
Harbor in Lake Erie.
Meanwhile,
winds had
"windrowed"
on Lake Michigan the sustained westerly
the ice so badly that
carferry
operations out of
Muskegon,
Mich.,
and Frankfort,
Mich.,
were halted on 17 February.
The
City of
Midland
lost one of her prop blades outside of Ludington,
Mich.
Direct icebreaking assists numbered just under 100 for the month.
134
The milder weather in early March eased ice conditions throughout
the Lakes.
The trend was encouraging enough for iron ore haulers to
schedule a resumption of traffic
to
western Lake Superior.
On 15 March
U.S. Steel's Anderson,
CaZZmay,
Clarke,
and Munson left Milwaukee for
Two
Harbors, Minn.
On 17 March the CaZZmay was the first to transit
the American locks at the
Sm.
The date was the earliest on record for
the opening of the "spring" season.
On Lake Erie the
seasm
opened 20
March with the arrival of 6000 tons of cement on the
S.
2'.
Crapo.
Most
shipping companies delayed outfitting their ships until later in April.
Thirty ships were operating at the end of the month.
As April began, emphasis on icebreaking in the lower lakes shifted
from western Lake Erie and the St.
Clair
region
to
the eastern end of
Lake Erie.
The Canadian cutter
McLeod
Rogers arrived in Port
Colborne,
Ont., for the opening of the
Welland
Canal on 4 April.
The
Ojibwa
was
enmute
to Buffalo for ice operations on 6 April when she sustained
steering damage and became beset 11 miles west of the city.
The
St.
Lawrence Seaway opened on schedule 4 April when the Norwegian vessel
Thorshope
entered the St.
Lambert
Lock. On the Detroit River the
J. W.
Wescott
II
began mail delivery for the
seasm
on 14 April.
Ice on the upper lakes continued
to
diminish throughout the month.
Coast Guard icebreaking operations
"Taconite"
on Lake Superior and the
Straits of Mackinac and "Oil Can" on Lake Michigan were terminated on 25
April.
The ice boom in the St.
Marys
River was removed 3 days later.
As shipping activity increased,
so did icebreaking and 63 direct assists
were recorded during the month.
At the beginning of May,
ice could still be found in the northern
bays, in eastern Lakes Superior and Huron, and especially in the Black
Rock Canal near Buffalo.
The last icebreaking assist of the
seasm
was
made by the
Km
in the Buffalo area when she assisted the
tiZ'eom0.
The
Ice Navigation Center in Cleveland ended its operations for the season
on 6 May and the "Open Buffalo"
operation ended on 12 May as the last
few pieces of drift ice finally melted.
4.2 Air-Lake (Water) Interaction
There is a flux of heat, moisture, and momentum between air and
water.
It is of interest
to
note
the effect of the heavy ice cover of
the winter of 1976-77 on these fluxes.
Figures
Em-b
and
4a-c
to
lOa-b
all show relatively high air temperatures
Over
and along the lee shores
of the Lakes.
The temperature gradient across a lake in the downwind
direction on each of these charts is a function of the conductive heat
transfer from water
to
air. The heat thus transferred is a combination
of sensible and latent, including the latent heat of fusion for water.
In the absence of ice, this transfer takes place at the air-water inter-
face.
When an ice sheet is present, additional freezing usually takes
place at its lower surface.
So either sensible heat from the water or
135

latent heat from new freezing must be transferred to the air through the
ice.
The rate of conduction depends on the nature of the ice, its
thickness,
and the temperature difference between water and air.
water
temperature in the Great Lakes is very near 0°C during all but the early
part of the winter. Thus, the water-air temperature difference is
primarily a function of air temperature.
Thermal conductivity of ice and
snow
varies with their
ensity.
Solid ice (lake ice or "blue" ice) has a
deysity
of 0.9 g/cm
!I
and a
thermal conductivity of about
030054
cal/cm
/sec/"C.
New fallen snow
has a
$ensity
of about 0.1 g/cm and a thermal conductivity of 0.00007
callcm
/sec/°C.
Closely packed snow, snow ice, slush, and "white" ice
have intermediate values.
The precipitation pattern discussed in Sec-
tion 2.1 led to a preponderance of blue ice during the winter of 1976-77
and a relatively small amount of snow cover and white ice.
Thus, one
would expect that the thermal conductivity of the ice cover was greater
than normal.
Both the nature of the ice and the below normal air temperatures
during the winter of 1976-77 would have increased heat flow into the
atmosphere; greater ice coverage and thickness would have decreased it.
Figures
4c,
8,
and
9c
show that the air temperature anomalies
expressed as standard deviations were the same over land as over water.
For this to be true, all the factors inhibiting or enhancing heat trans-
fer must total approximately zero. We conclude that the amount of heat
transferred from water to air varies linearly with the temperature
difference between water and air,
and is almost independent of the
existence or thickness of ice cover.
Moisture is also transferred from lake to atmosphere.
The rate of
evaporation depends on the temperature of both water and air, the rela-
tive humidity, and the rate of removal of the moistened air from contact
with the evaporating surface.
The low temperature of water and air restricts the amount of water
that can be evaporated, but this is only
true
in a relative sense.
While the absolute humidity of cold air must necessarily be low, the
relative humidity can quickly approach 100 percent whenever a water
surface much warmer than the air is encountered.
Horizontal wind flow is rather ineffective in evaporating moisture
from large bodies of water.
When air movement is laminar,
mOst
of the
water is exposed only to air that has already become saturated. Verti-
cal air currents, however,
carry the moisture up away from the water
surface and allow the entire area of the lake to be an effective evap-
orating surface. Vertical air currents arise from air mass instability.
An air
mass
becomes
more
unstable whenever it is heated from below.
Colder air is more strongly heated than warmer air over water of a
nearly constant temperature.
Thus,
in a colder winter
more
moisture per
unit area of open water will be introduced into the atmosphere.
136

Counteracting this greater evaporation per unit area is the de-
crease in exposed area as the ice cover increases.
There is no direct
way to determine whether the increase of evaporation due to greater
instability was greater than the decrease due to increasing ice cover.
Recourse can be made to sunshine statistics.
Much of the moisture
evaporated from the Great Lakes in winter forms into stratocumulus
clouds,
whose persistence is a characteristic feature of the local
climate.
Data for Detroit are used to compare the percent of possible
sunshine during the winter of 1976-1977 to normal percentages (Table 7)
Table 7. Percentage of
Possibk
Sunshine at Detroit,
Mich.
Month and Year
NOTClll~l
Actual
%
%
Dec.
1976
28
49
Jan.
1977
38
49
Feb.
1977
46
46
Mar.
1977
49
59
Of the 4 months of ice cover 3 had
more
sunshine than normal;
February had the normal amount. We conclude that ice cover inhibited
evaporation
more
than cold air mass instability enhanced it. The
lighter-than-normal precipitation alluded to above is further support
for this conclusion.
It should be noted, on the other hand, that a
general lack of cyclonic activity contributed somewhat to the greater
amount of sunshine.
Ice cover also prevents the conversion of wind energy into waves.
This should add an increment to wind velocity over the region.
All
observers described the winter as quite windy, but the various influ-
ences which brought about this wind cannot be separated.
The extremely heavy snow that fell in narrow bands on some of the
lee shores requires explanation.
It was obviously "lake snow": there
were no large scale weather disturbances in the area.
Communities only
137

a few miles away received little or no precipitation during these
events.
Classically lake snow has been attributed to instability
showers dropping moisture picked up from the upwind lake.
Some atten-
tion has been given to convergence in the wind flow as an enhancing
factor.
This convergence my arise from funneling or rising terrain
features or from differences in frictional wind retardation over land
and over water. Available moisture during the winter of 1976-77 "as
demonstrably less than normal.
Some of the heaviest snows were on the
downwind ends of almost completely ice-covered lakes.
Instability "as
probably greater than normal,
though it is hard to determine by how much
at a particular time and place.
Convergence in the wind flow was con-
siderably greater than normal, and it "as concentrated in precisely the
areas that got heavy snow.
Convergence may play a larger role than "as
previously suspected in the production of heavy snow bursts on the lee
shores of the Great Lakes.
4.3 Hydrology
It is indeed fortunate that the satellite and SLAR aircraft cover-
age of the Great Lakes "as initiated prior to the Great Winter of 1976-
77.
The use of remote-sensing data from these valuable research tools
has permitted a thorough and unprecedented series of ice observations to
be made on the Great Lakes during the worst ice season certainly in more
than 40 years and probably in the past 100 years.
Satellites have allowed us to see the effectiveness of the wind in
concentrating ice; the cooling of the upwelling water as the Lakes
become ice-producing "machines"; the effect of the stored heat on Lake
Ontario,
which produced the least ice;
the new transparent ice trans-
formed into older ice by movement, currents, and
snow
cover; the zones
of weakness;
and the patterns of breakup of certain parts of the ice.
The study of ice on the Great Lakes has been advanced from an art
to a science by the remote sensors routinely providing half-hourly
observations from geostationary satellites.
The science of ice fore-
casting has been enormously advanced by these new observations.
Al-
though this paper is largely descriptive and attempts to do little
more
than document the intensity of a memorable ice year, it will be a source
of basic data for generations to come.
Studies of lake ice and climatic
fluctuations cannot afford to overlook this record.
With improved quantitative data on area1 extent of ice and improved
thermal data on both ice and water,
one may confidently predict a number
of studies on heat balance, heat exchange and storage capacity of the
Lakes,
effects of wind stress on lake ice, relation of freezing
degree-
days to ice formation, the relation of wind direction to local area
icing conditions, etc.
The amount of ice in each of the five Great Lakes and Lake St.
Clair is a complex function of temperature, wind, precipitation, shape
138

of the lake,
total water mass in the lake, and surface area of the lake.
Each lake is unique in its response to the dynamic meteorological and
hydrological events and the thermodynamic properties of the water mass.
While the Lakes do react similarly at times, e.g., the first freeze,
they react quite differently at other times.
The effect of ice on the
climate, commerce,
transportation,
and energy consumption of the inhab-
itants in the Great Lakes Basin is significant, and improved forecasting
of ice conditions,
which should result from satellite and aircraft
remote.sensing,
will facilitate and improve transportation and commerce
during ice seasons
to
come.
One of the popular new tools in lake hydrology is the use of com-
puter models to study almost all phases of hydrology from pollutant
dispersion to three-dimensional thermodynamic response
to
thermal load-
ing.
In this present era of increased environmental awareness, it is
important that these models be as accurate as possible.
Timely satel-
lite observations allow hydrologists to verify their models. The com-
bination of these two new approaches,
modelling
and satellite observa-
tions,
can be a very powerful tool in man's continuing quest for an
improving environment.
5.
ACKNOWLEDGMENTS
Some of the data and charts used in this study were supplied by
Damn
E. Boyce, Lawrence A. Hughes, John
Mornan,
and Bernard Dewitt.
Jenifer
Wartha
corrected and organized the satellite images used.
David
G. Forsyth prepared the corrected and computer enhanced satellite
images.
Freezing degree-day calculations and charts were prepared by
Frederick A. Keyes. Minimum temperature charts were plotted and analyzed
by Kevin Cosgriff.
The manuscript was typed by Barbara
Lawton,
Patricia
D. Willis, and Mitchell
Lerner.
Composite ice charts were compiled and
drafted by George Leshkevich with drafting assistance by Iris Proctor.
6.
REFERENCES
Assel, R. A. (1976):
Great Lakes ice thickness prediction.
J. Great
Lakes Res. ,
2(2):248-255.
Egger,
J.
(1977):
On the linear theory of the atmospheric response to
sea surface temperature anomalies.
CT.
Atmos.
Sci.,
34(4):603-614.
Legeckis, R. V.,
and Pritchard, 3. A., (1976): Algorithm for correcting
the VHRR imagery for geometric distortions due to the earth's
curvature and rotation, NOAA Tech. Memo. NESS-77, National Techni-
cal Information Service, Springfield, Va.
22151.
139

Leshkevich, G. A. (1976): Great Lakes ice cover, winter 1974-75, NOAA
Tech. Rept.
ERL 370-GLERL 11, National Technical Information
Service, Springfield, Va.
22151.
Leshkevich, G. A. (1977): Great Lakes ice cover, winter 1975-76, NOAA
Tech. Memo. ERL GLERL-12, National Technical Information Service,
Springfield, Va.
22151.
Namias,
J.
(1969):
Seasonal interaction between the North Pacific Ocean
and the atmosphere during the 1960's. Mon. Weather Rev., 97:172-
173.
Namias, J. (1971):
The 1968-69 winter as an outgrowth of sea and air
coupling during antecedent seasons.
J. Phys.
Oceanogr.,
1~65-68.
Namias,
5.,(1978):
Multiple causes of the North American abnormal
winter 1976-77.
Mon. Weather Rev.,
106:279-295.
Noble, V. (1976): Aerial ice reconnaissance and ice advisory services.
The Great Lakes and St. Lawrence Seaway, 1 December 1976
-
15 May
1977.
Atmospheric Environmental Service, Dept. of the Environment,
Downsview, Ont., Canada.
Richards, T. L. (1963): Meteorological factors affecting ice cover on
the Great Lakes.
Proc.
Sixth Conf. on Great Lakes Res., Great
Lakes Res. Div.,
Univ. of Michigan, Ann Arbor,
Mich.,
Publication
10, pp. 204-215.
Rogers, J. C.
(1976a):
Long-range forecasting of maximum ice extent on
the Great Lakes, NOAA Tech. Memo. ERL GLERL-7, National Technical
Information Service, Springfield, Va.
22151.
Rogers,
J.
C.
(1976b):
Sea surface temperature anomalies in the eastern
North Pacific and associated wintertime atmospheric fluctuations
over North America, 1960-73. Mon. Weather Rev.,
104:985-993.
Rondy, D. R. (1971):
Great Lakes ice atlas, NOAA Tech. Memo. NOS LSCR
1, National Technical Information Service, Springfield, Va.
22151.
Rondy, D. R. (1976):
Great Lakes ice cover. In:
Great Lakes Basin
Framework Study.
Appendix 4
-
LimnoZogy of Lakes
and
h?mbayments,
Great Lakes Basin Commission, Ann Arbor,
Mich.
48105.
Schertler, R. J.; Mueller, R. A.; Jirberg, R. J.; Cooper, D. W.;
Heigh-
way, J. E.; Holmes, A. D.; Gedney, R. T.; and Mark, H. (1975):
Great Lakes all-weather ice information system, NASA Tech. Memo.
NASA TM X-71815, National Technical Information Service, Spring-
field, Va.
22151.
140

Snider, C. R.
NWS
OSD
22151.
(1974): Great Lakes ice forecasting, NOAA Tech. Memo.
1, National Technical Information Service, Springfield, Va.
U.S. Coast Guard (1976.x):
Ninth Coast Guard District Domestic
Icebreak-
ing Plan, Annex W to CCGD Nine Operation Plan No.
l-(FY),
Office of
the Commander, Ninth Coast Guard District, Cleveland, Ohio.
U.S. Coast Guard
(1976b):
Joint United States Coast Guard-Canadian
Coast Guard Guide to Great Lakes Ice Navigation, Office of the
Commander, Ninth Coast Guard District, Cleveland, Ohio.
6.1 Data Sources and Supplemental Bibliography
Dickson, R. R. (1977): Weather and circulation of November 1976.
MO??.
Weather Rev.,
105:239-240.
Ludlum, D. M. (1966): Early American winters, 1604-1820. Monograph,
Am. Meteor.
Sot.,
Boston, Mass., 285 pp.
Ludlum, D. M. (1968):
Early American winters, 1821-1870. Monograph,
Am. Meteor.
Sot.,
Boston, Mass., 257 pp.
NOAA, Environmental Data Service, National Climatic Center,
Climato-
logical Data, Minnesota, Wisconsin, Michigan, Illinois, Indiana,
Ohio, Pennsylvania, New York, Asheville.
Phillips, D. W.,
and
McCulloch,
J. A. W. (1972): The climate of the
Great Lakes Basin.
Climatological
Studies No. 20.
Environment
Canada, Toronto, Ont. 40 pp.
Taubensee, R. E. (1977): Weather and circulation of December 1976.
Mon. Weather Rev.,
105:368-369.
U.S. Departments of Agriculture and Commerce (1976-77):
WeekZy
Weather
and Crop
Bull.,
63(45)-64(17).
Wagner,
J.
A. (1977):
Weather and circulation of January 1977.
Mon.
Weather Rev.,
105:553-554.
141
COVERNMENT
PRlNTlNG
orr,cr,
1978-87,-6’)‘1
